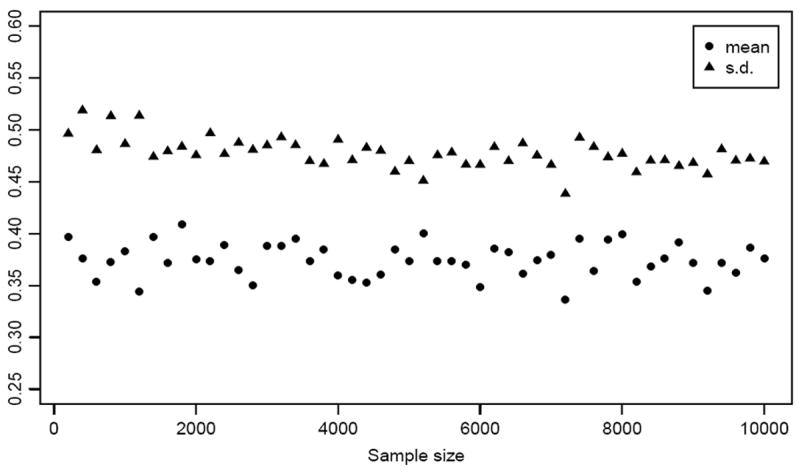
Figure 3.

The mean (circles) and standard deviation (triangles) of the AUC test statistic from simulations at sample sizes ranging from 200 to 1000 in steps of 200. Each point is calculated from 1000 simulated data sets using the configuration μ1 = 0.3, μ2 = 0 and ρ = 0.
