
Figure 4.
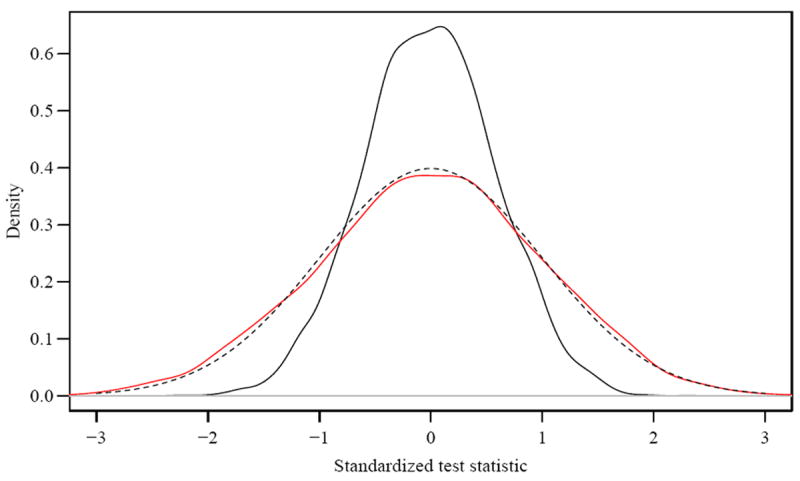
The empirical distributions of the AUC Test in two specific instances of a non-nested model: red curve for μ1 = 0, μ2 = μ3 = 0.3 and black for μ1 = 0.3, μ2 = μ3 = 0. In both cases the common AUC is 0.584 and the theoretical reference distribution is given by the dashed line.