
Figure 1.
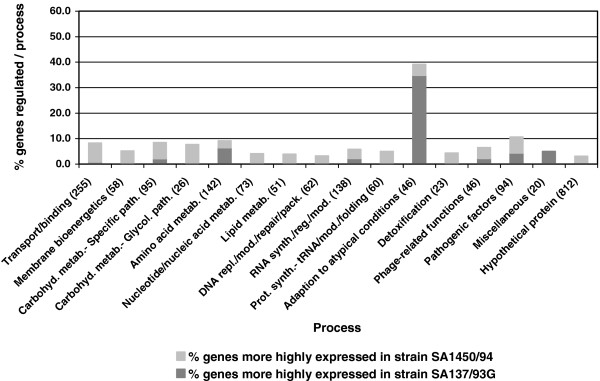
Transcription profiling: comparison of transcriptomes (OD600 = 0.8-1.0) of VISA strain SA137/93G and the related VSSA strain SA1450/94. The regulated genes are represented as percentage of all genes constituting a process category. The number of genes per process category is shown in brackets.