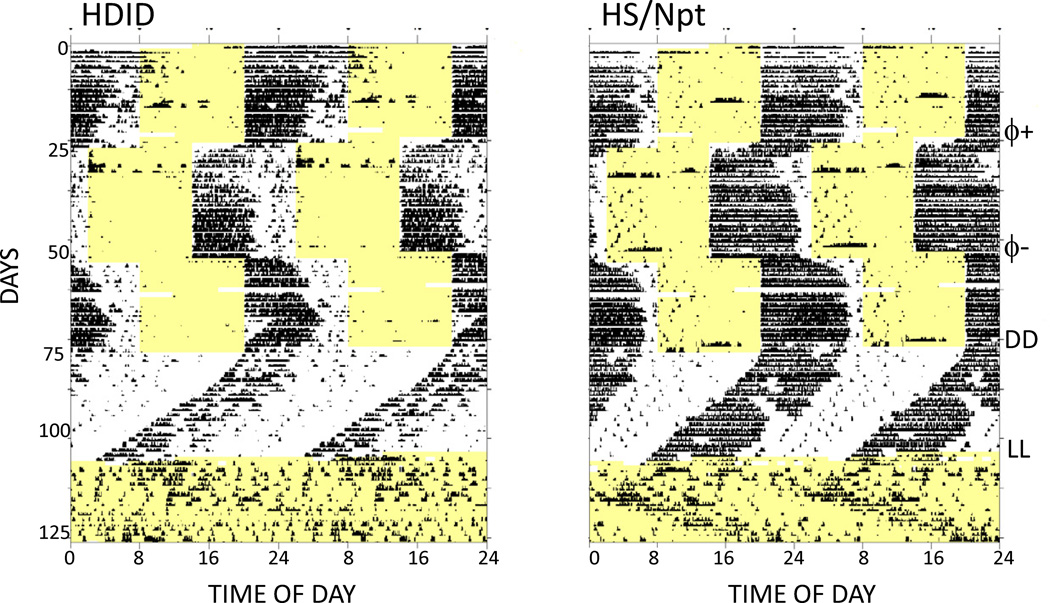
Figure 1.
Double-plotted, raster-style circadian actograms from one representative HDID-1 and one representative HS/Npt mouse. Each 10-minute bin is represented by a bar whose height is proportional to the amount of activity occurring within that time bin. Time of day (48-hour span) and successive days are indicated along the X- and Y-axes respectively. Yellow shaded areas show times that the lights were on. Animals were initially maintained under a light-dark 12:12 cycle, and experimental manipulations are indicated at the far right, as follows: 6-hour phase advance, ϕ+; phase delay, ϕ-; first day of constant darkness, DD; first day of constant light, LL.

