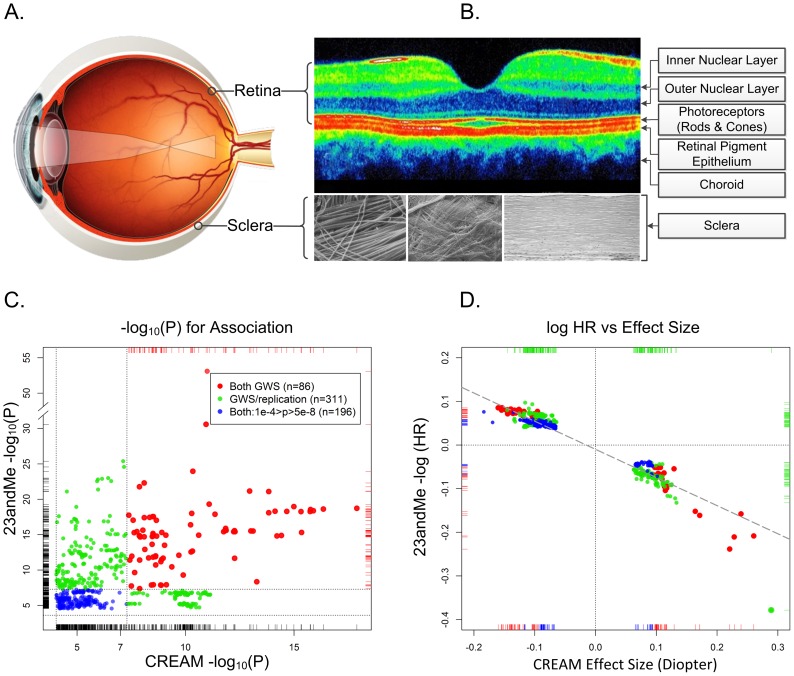
Figure 1. The physical, biological, and genetic basis of myopia.
Panel A. The optical basis of myopia. Parallel lights from distantly viewed object focus anterior to the retinal plane, causing blurred distance vision. Although myopia can result from alterations in the optical system (the cornea and lens), myopia is almost always the result of excessive growth of the posterior segment of the eye. This growth occurs through active remodeling of the fibrous sclera. Panel B. Optical coherence tomography cross section of a normal posterior pole. The depression in the middle is the fovea, where the concentration of photoreceptors (and by extension the visual acuity) is greatest. Only four of the ten layers of the neural retina are pointed out. In refractive regulation, visually induced signals are generated by the photoreceptors and processed by other retinal cells (notably, by the amacrine cells, which release neuromodulators and neurotransmitters (including dopamine)). These retinal signals must traverse the retinal pigment epithelium and the highly vascularized choroid in order to regulate eye growth through active remodeling of scleral ECM. The sclera is composed mainly of collagens, but also contains active fibroblasts and normal constituents of ECM (proteoglycans, MMPs, TIMPs, etc.). The composition of the sclera with its organized structure of collagen fibrils are shown under three different magnifications. Panel C. Statistical significance and effect sizes for 23andMe and CREAM studies. Statistical significance of overlapping SNPs with association p-values <1e-04 in both datasets are plotted. Red dots show SNPs that were genomewide significant (GWS; p<5e-08, −log10(p)>7.3) in both studies. Green dots represent SNPs that were genomewide significant in one study and fulfilled our statistical criterion for replication in the other study. Blue dots show SNPs whose p-values for association were between p = 10e-4 and 5e-8 in both datasets. The replication thresholds were the Bonferroni-corrected p-values for a family-wise error rate of 0.05: since the CREAM dataset contained 544 (nonindependent) SNPs that were genomewide significant in 23andMe, the Bonferroni-adjusted p-value threshold for replication was 0.05/544 = 9.2e-05 (or −log10(p) = 4.037). Similarly, there were 308 genomewide significant SNPs in CREAM that were also in the 23andMe dataset presented in Table S2 of Kiefer et al. The replication threshold was therefore 0.05/308 = 2.4e-04 (−log10(p) = 3.615). Dotted horizontal and vertical lines show the thresholds for genomewide significance and replication. Panel D. Natural logarithm of hazard ratios for myopia in 23andMe vs. effect size (beta coefficient) in CREAM. Both analyses assumed an additive effect of the representative allele on the scale used in the analyses. Color coding is identical to the left panel. The dashed diagonal line shows the linear regression of the 23andMe log hazard ratios on CREAM effect sizes. All SNPs are concordant as to the expected direction of their effects (i.e., positive HRs for myopia would be expected to increase the severity of myopia and negative HRs would be expected to decrease the degree of myopia). Dotted lines show the origins where the effects are null.

