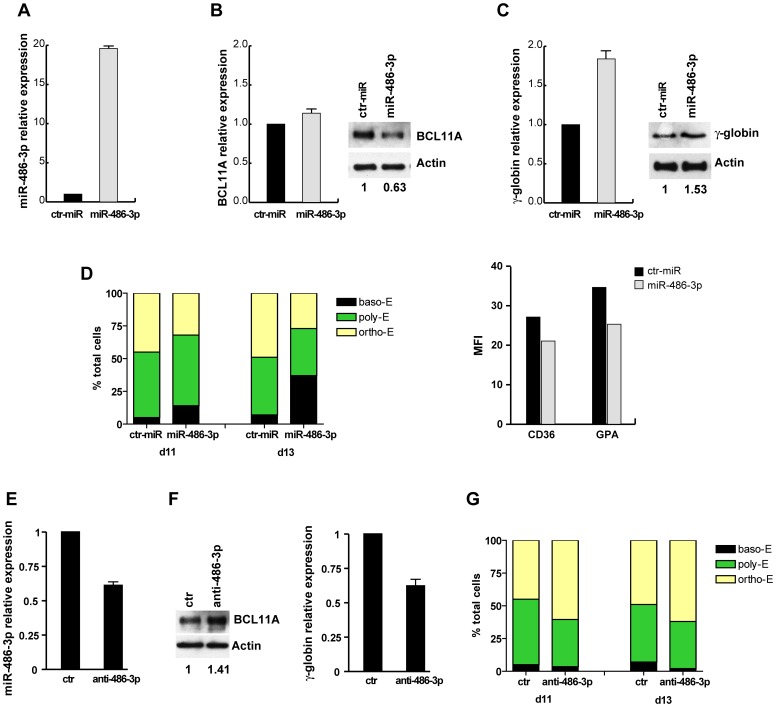
Figure 3. miR-486-3p regulates BCL11A protein levels and affects γ-globin expression.
(A) Real-Time PCR of miR-486-3p expression in PB unilineage E cultures transfected with miR-486-3p or non-targeting oligonucleotide (ctr-miR). Real-time PCR was performed in triplicate, 48 h after transfection and values are reported as fold changes with respect to ctr-miR. Error bars indicate SD (n = 3). (B) (left) XL BCL11A expression analyzed by Real-time PCR in 4 days E culture transfected with miR-486-3p or ctr-miR. (right) Western blot of BCL11A in transfected E cells seven days post-transfection. Actin was used as loading control. (C) The expression of γ-globin was analyzed by Real-time PCR and western blot in transfected cells. Analysis was performed ten days post-transfection (day 11 of culture). Error bars represent and indicate SD from three independent experiments. (D) (left) Percentage of basophilic (baso-E), polychromatophilic (poly-E) and orthocromatic (ortho-E) erythroblasts ten and twelve days (days 11 and 13 of culture) after transfection. A representative experiment out of three is presented. (right) Mean fluorescence intensity (MFI) ratio of CD36 and GPA in transfected E cells analyzed nine days post-transfection. The values are reported as the ratio between MFI of the sample and the isotype control. A representative experiment out of three is shown. (E) Real-time PCR of miR-486-3p expression in E cells transfected with anti miR-486-3p LNA (anti-486-3p) or non-targeting LNA oligonucletide (ctr). Analysis was performed three days post-transfection. Error bars represent standard deviation and indicate the average values from three independent experiments. (F) (left) BCL11A expression analyzed by western blot in E cultures transfected with anti-486-3p or ctr LNA oligonucleotide, 7 days post-transfection. Actin was used as loading control. (right) Real-time PCR of γ-globin in transfected cells performed at day 11 of culture. A representative experiment out of three is shown. (G) Percentage of differentiating cells at day ten and twelve after transfection (days 11 and 13 of culture).

