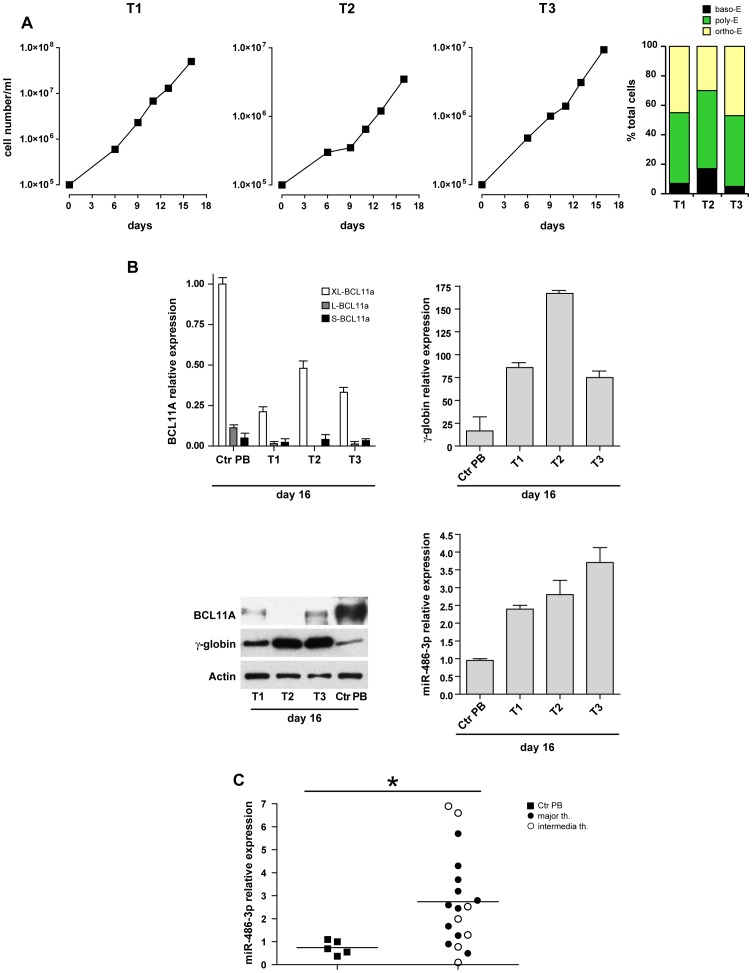
Figure 4. Expression of BCL11A, γ-globin and miR-486-3p in unilineage erythroid cultures derived from thalassemic patients.
(A) Growth curves and percentage of differentiated erythroid cells in CD34+ HPCs unilineage erythroid cultures derived from three β major thalassemic patients (T1, T2, T3). (B) Real-Time PCR and western blot analysis of BCL11A and γ-globin in erythroid cells derived from T1, T2, T3 and normal peripheral blood, performed at day 16 of cultures. Actin was used as loading control. Real-Time PCR of miR-486-3p in T1, T2, T3 patients and in normal peripheral blood (day 16 of cultures). (C) Real-time PCR analysis of miR-486-3p individual values in erythroid cells derived from peripheral blood of 5 healthy donors and 18 β-major or β-intermedia thalassemic patients.

