Figure 1.

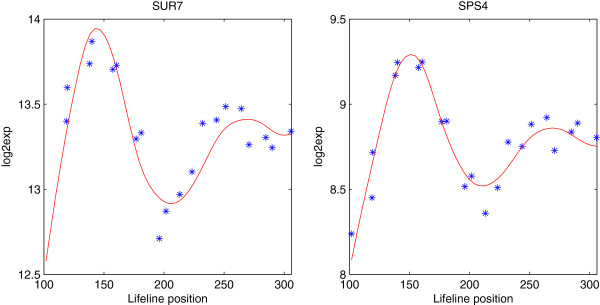
Time course measurements (star) and the estimated expression curves (solid) for genes SUR7 and SPS4 in the yeast cell cycle data, plotted in log2 scale.

Time course measurements (star) and the estimated expression curves (solid) for genes SUR7 and SPS4 in the yeast cell cycle data, plotted in log2 scale.