
Figure 4.
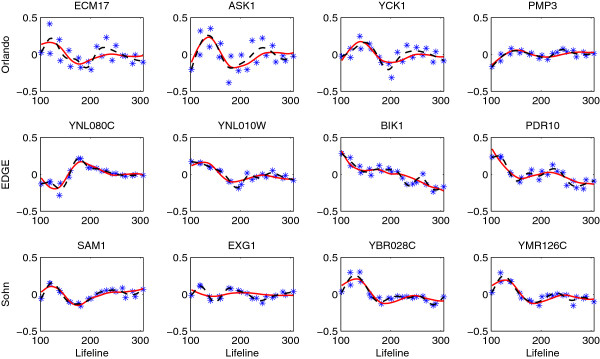
Genes not selected by the proposed method but by [17](first row), EDGE (second row) and Sohn’s method (third row) for testing non-flat expressions in the wild type data (FDR = 0.01). The observed expressed values (star) and the estimated expression curves (FPCA-solid, dashed-B splines) are centered.