
Figure 3.

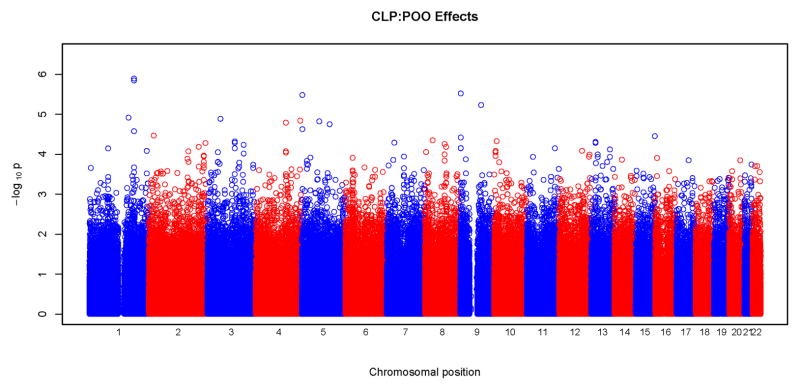


Physical locations of GWAS p-values for parent-of-origin (differential transmission from fathers and mothers) effects. Observed p-values on the logarithmic scale are sorted by physical location on the 22 autosomes. Results of the four phenotypes are plotted separately: a) CL, b) CLP, c) CL/P and d) CP.