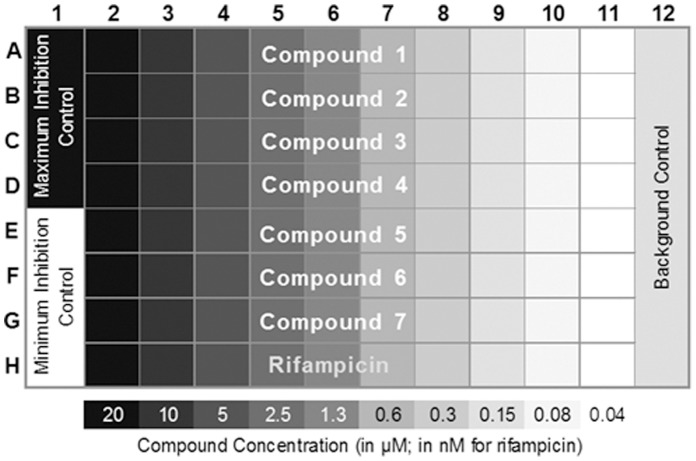
Figure 1. Final assay plate layout.
The plate format is shown. Column 1 contains maximum inhibition control (rifampicin) in Rows A–D and minimum inhibition control (no compound) in Rows E–H. Column 12 is not inoculated with cells. Compounds are tested across each Row A–G in a two-fold serial dilution starting at 20 µM – concentrations are indicated below. A rifampicin dilution series is included in Row H starting at 20 nM.

