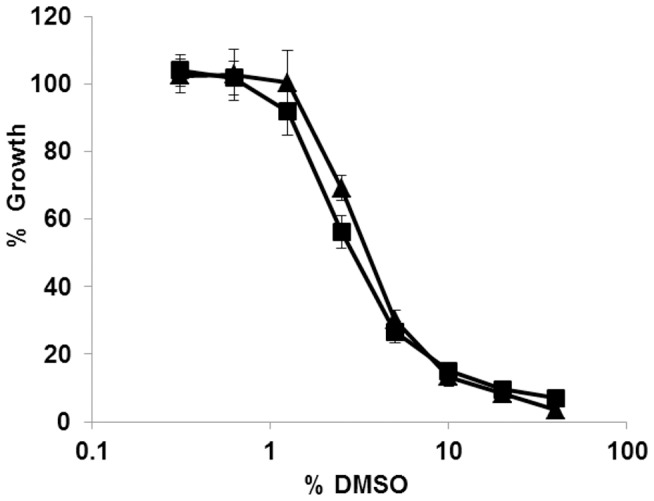
Figure 4. The effect of DMSO on growth of M. tuberculosis.

M. tuberculosis growth was monitored in 96-well plates. DMSO was added as serial dilutions at a starting concentration of 40%. After 5 d of incubation at 37°C % growth was calculated by dividing RFU (triangles) or OD590 (squares) by the average of 4 control culture wells containing no DMSO. Results are the average of 8 independent dose response curves; error bars represent standard deviation.
