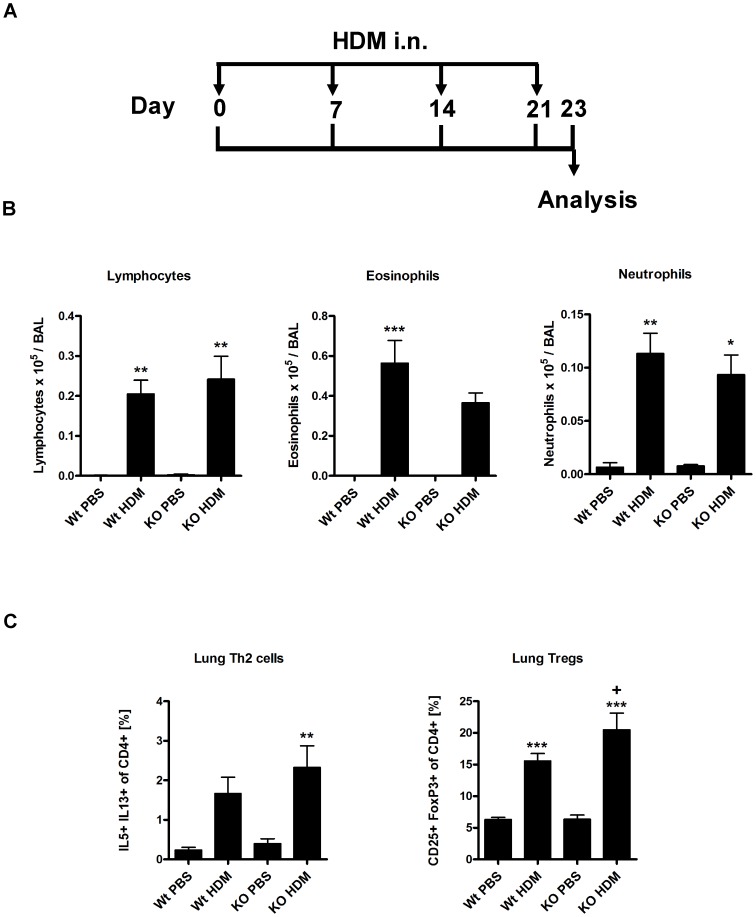
Figure 9. HDM induced acute asthma is not reduced in β5i KO mice.
(A) HDM asthma induction protocol. (B) Differential BAL cytospins cell counts. (C) Lung Th2 and Treg cells profile. The percentages of IL5+ IL13+ and CD25+ FoxP3+ of CD4+ T cells were measured by flow cytometry from the homogenized lungs. The data are representative of two independent experiments and shown as the mean ± SEM (n = 8–15). (*) and (+) represent comparison of PBS vs OVA and Wt OVA vs KO OVA treatment groups respectively. */+P<0.05, **/++P<0.01, ***/+++P<0.001.

