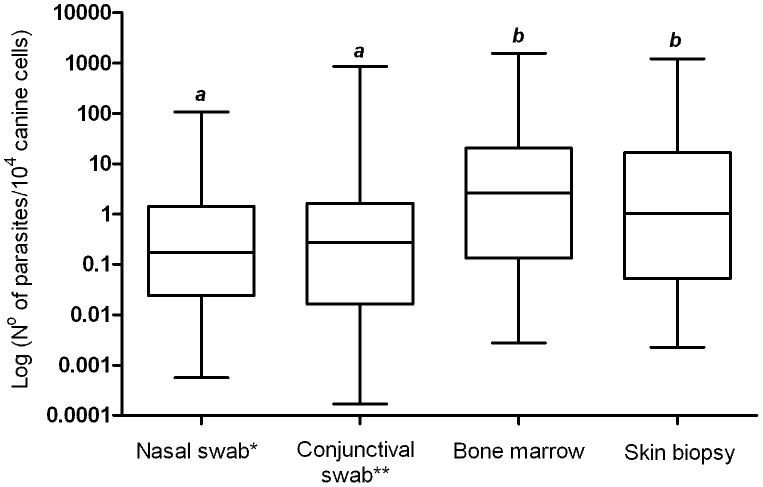
Figure 3. Estimated parasite loads in different clinical samples from 62 naturally infected dogs.
Data distributions with distinct letters are significantly different according to the Mann-Whitney U test. Nasal swab and bone marrow (P = 0.0004); nasal swab and skin biopsy (P = 0.0074); conjunctival swab and bone marrow (P = 0.0076); conjunctival swab and skin biopsy (P = 0.04). *Only the left nostril was considered. **Only the left conjunctiva was considered.

