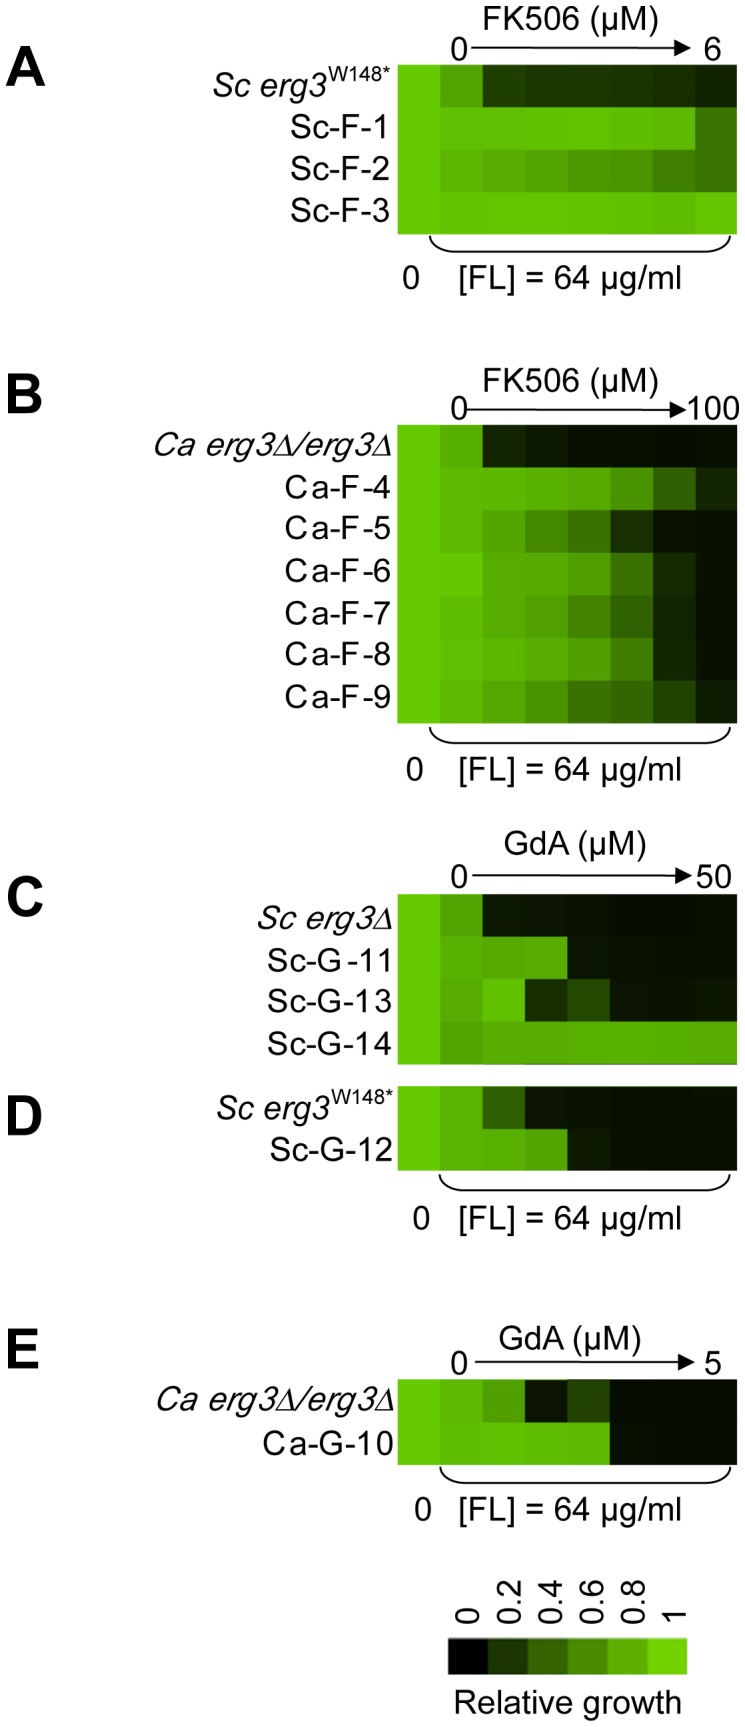
Figure 2. The populations evolved distinct resistance profiles.

Levels of resistance to azole and FK506 (A, B) or azole and geldanamycin (C–E) of evolved strains of S. cerevisiae (A, C, D) and C. albicans (B, E), relative to their ancestors. Resistance was measured with a constant concentration of azole and a gradient of geldanamycin or FK506 in YPD at 30°C for 2 days (B) or 3 days (A, C–E). Optical densities were averaged for duplicate measurements and normalized relative to drug-free controls (see colour bar). GdA = geldanamycin and FL = fluconazole.
