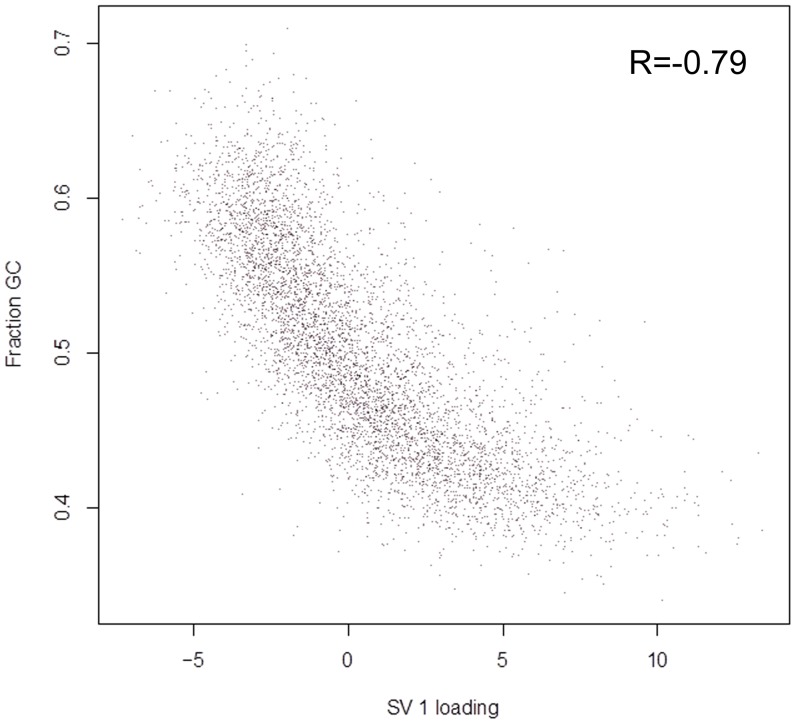
Figure 2. RNA-Seq SVA Loading Reflects GC Content in Transcripts.
Loadings from the first surrogate variable, obtained from analysis of the combined RNA-Seq and microarray expression profiles, reflect transcript GC content. Unexplained variation in the combined data set was captured using Surrogate Variable Analysis [42], which returns scores and loadings. Each point represents a gene, located based on its first surrogate variable (SV 1) loading and GC content. Spearman correlation (R) is–0.79.

