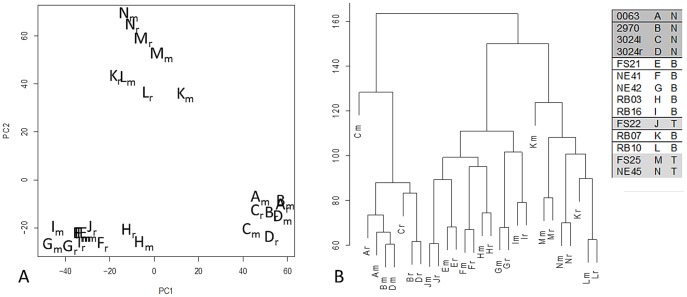
Figure 3. Expression Profiles Cluster by Sample Post-SVA Correction of RNA-Seq.
Variation among expression profiles obtained using RNA-Seq is similar to that obtained using microarray after removing contributions of the first surrogate variable [42]. Each letter denotes a sample from a dog having a normal (N), B-cell (B), or T-cell (T) diagnosis as in the legend, with subscript ‘m’ run on the microarray platform and subscript ‘r’ run on the NGS platform. a) Principal component scores b) Hierarchical clustering

