
Figure 6. GeneGo Pathway Maps.
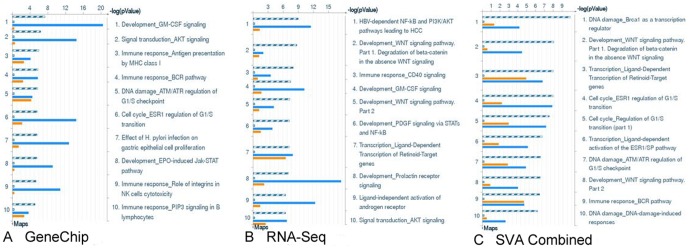
GeneGO Pathway Maps by expression (orange) and topology overlay (blue). Similar genes are in grey and common genes (in all samples) are in stripes. A) Top ten maps based on microarray platform B) Top ten maps based on RNA-Seq platform C) Top ten maps based on combining the microarray data and RNA-Seq data using SVA.