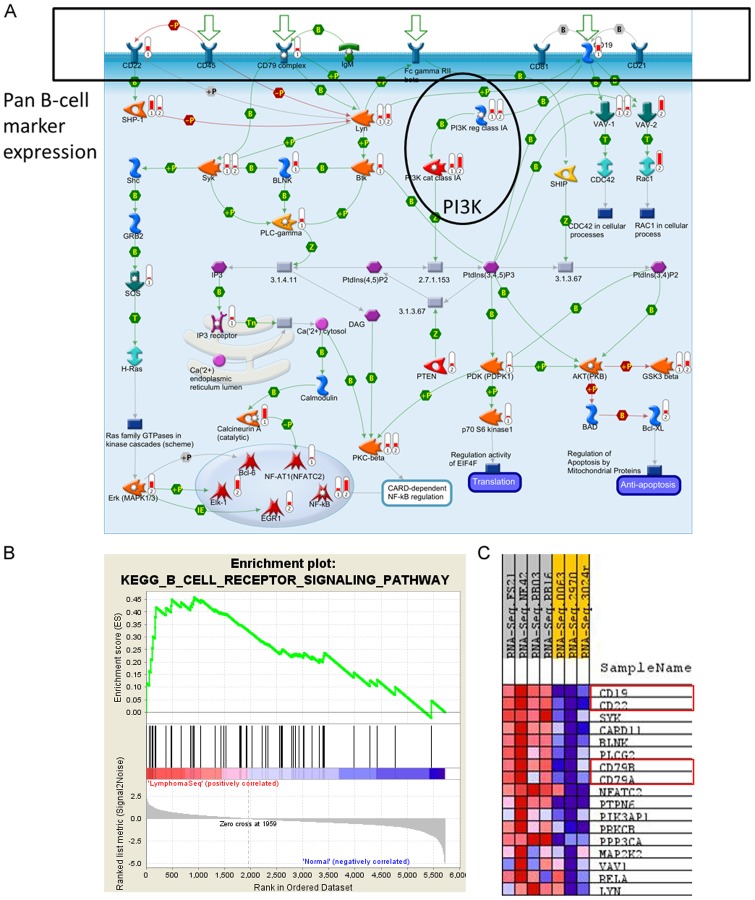
Figure 7. Canine B-Cell Lymphoma Pathway Analysis.
a) ‘Immune Response BCR Pathway’ map generated from the combined SVA GeneGo dataset shows pan B-cell markers (CD19, CD22, CD79). The level of indicator 1 at each node denotes upregulated transcriptional expression BvN. The level of indicator 2 at each node denotes topologically discovered transcriptional activators based of the Hidden Nodes Algorithm. b) Supporting gene set enrichments for B cell biology from the top 20 sets by GSEA using the version 2.5 and 3.0 gene set databases (highlighted). The three B-cell maps shown in version 2.5 but not version 3.0 are still represented in the 3.0 enrichment list, but at a lower rank. Namely, BIOCARTA_BCR_PATHWAY is rank 22, ST_B_CELL_ANTIGEN_RECEPTOR is rank 27, and SIG_PIP3_SIGNALING_IN_B_LYMPHOCYTES is rank 33. c) Pan B-cell markers (Gene identifiers boxed in red) enriched in lymphoma in GSEA set ‘KEGG_B_CELL_RECEPTOR_SIGNALING_PATHWAY’, which was chosen because it represents a similar signaling space to the GeneGo map in part a.

