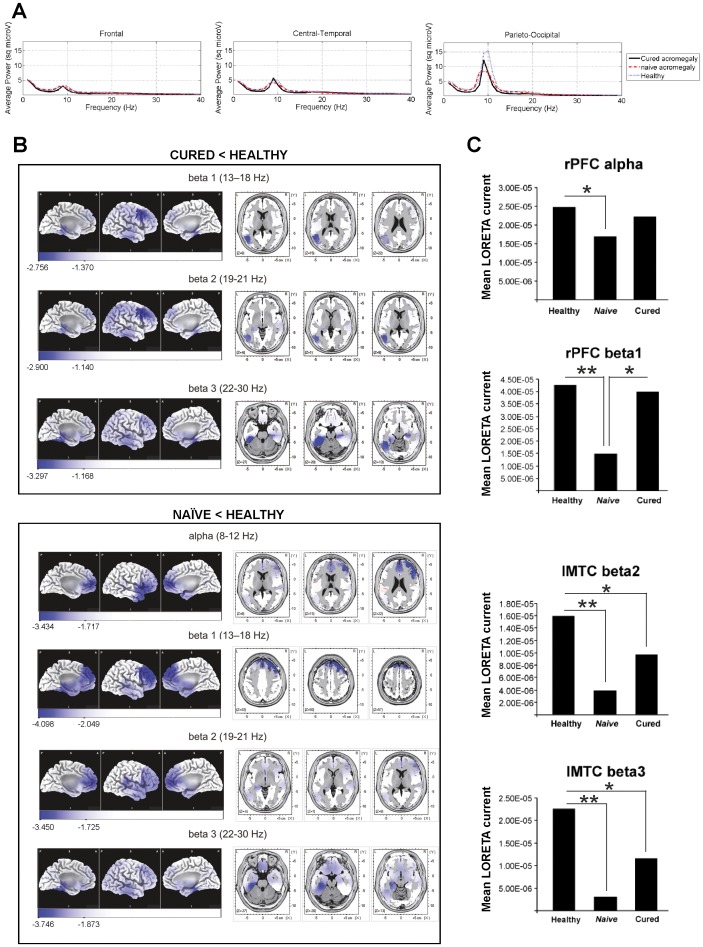
Figure 2. Neurophysiological results of patients with acromegaly.
(A) Power spectra differences (frequency range: 1–40 Hz) among patient groups and healthy controls. Decreased EEG power was observed in fast bands (alpha and beta) for both patient groups. Note the decreased power in patients with acromegaly at peak alpha frequency, 10 Hz. (B) LORETA comparisons between acromegaly patients and healthy controls. Upper panel: comparison between cured patients and healthy subjects. Highest significant LORETA differences were found in left medial temporal cortex in beta 2 band (4 significant neighboring voxels, 1.37 cm3, p<0.04) and beta 3 band (15 significant neighboring voxels, 5.14 cm3, p<0.007). Cured patients showed significantly lower LORETA activity than healthy subjects in cortical areas shown in blue. Lower panel: comparison between naïve patients and healthy subjects. Highest significant LORETA differences were found in left medial temporal cortex in beta 2 band (8 significant neighboring voxels, 2.74 cm3, p<0.012) and beta 3 band (30 significant neighboring voxels, 10.29 cm3, p<0.005) and in right dorsolateral PFC in alpha (8 significant neighboring voxels, 2.74 cm3, p<0.012) and beta 1 (28 significant neighboring voxels, 9.604 cm3, p<0.006) bands. Naïve patients showed significantly lower LORETA activity than healthy subjects in cortical areas shown in blue. Scales show maximal t value and maximal significant t value (p<0.05, corrected for multiple comparisons). (C) ROI analysis comparisons among groups. ROI LORETA activity in acromegaly patients is reduced as compared to healthy subjects. *p<0.05; **p<0.01, corrected for multiple comparisons.

