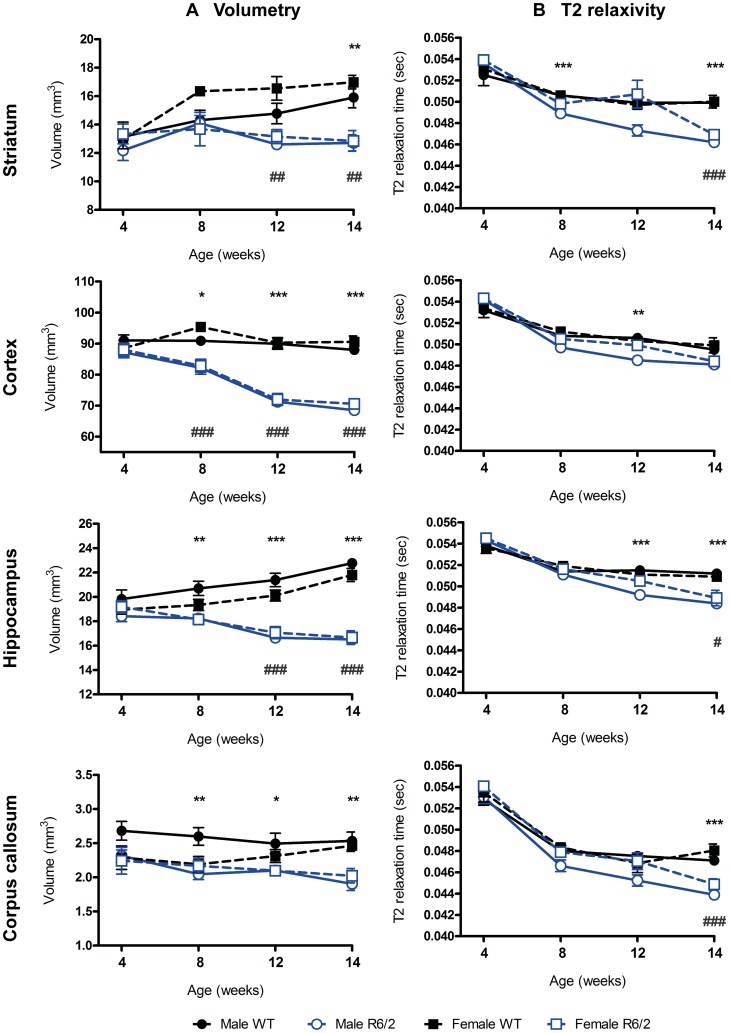
Figure 5. MRI assessment of brain volumetry and T2 relaxivity in WT and R6/2.
(A) Regional brain volumes assessed through MRI (volumetry) became progressively smaller in both male and female R6/2 mice versus WT, with the exception of the female R6/2 corpus callosum, which did not differ as compared to WT at any age. (B) T2 relaxation times (T2 relaxivity) progressively shortened for both WT and R6/2 with age, but this was significantly exacerbated in the R6/2 in all regions of interest investigated. Data presented as means ± SEM; males: *p<.05, **p<.01, ***p<.001, females: #p<.05, ##p<.01, ###p<.001.

