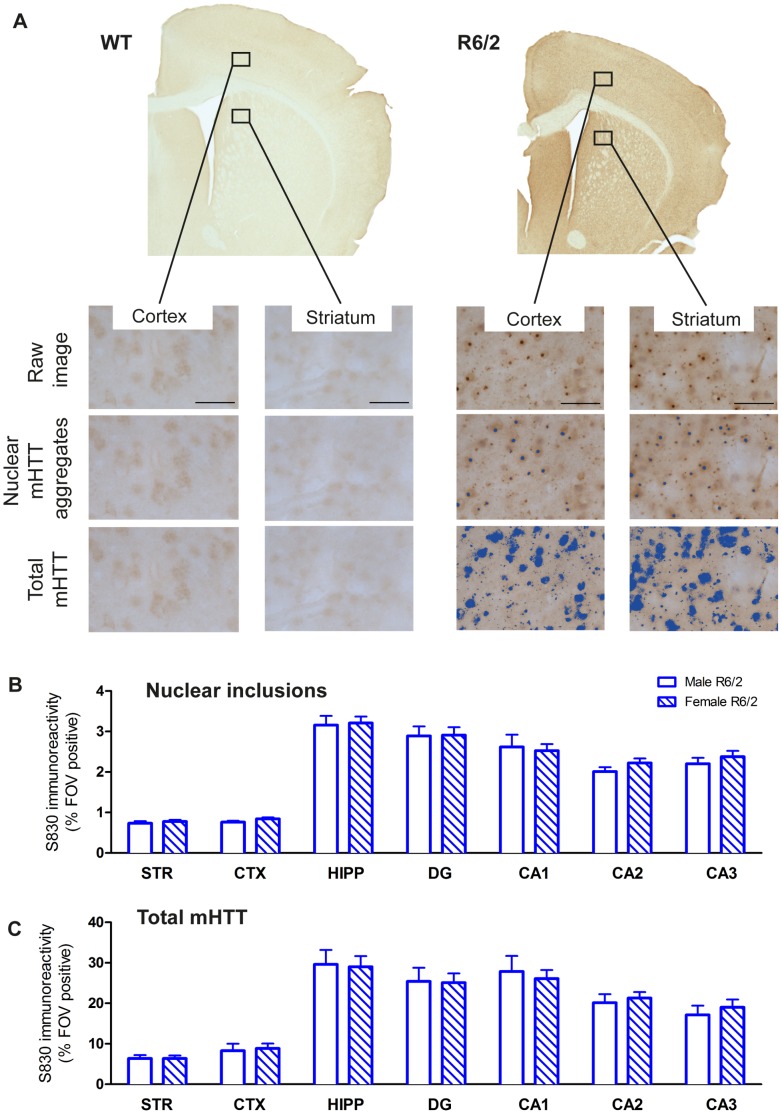
Figure 6. Quantification of mHTT accumulation.
(A) Representative coronal sections from 14 weeks old WT and R6/2 mouse brains stained with the S830 antibody for the detection of mHTT. Levels were quantified within seven brain regions using an intensity threshold-based image analysis tool optimized for the detection of nuclear inclusions, or total levels of mHTT (neuropil aggregates and diffuse nuclear accumulation, highlighted in blue); scale bar 50 µm. Percentage of sampled field of views (FOVs) positive for S830 stain of nuclear inclusions (B), and percentage of FOV positive for total mHTT (C); there were no significant differences between male and female R6/2 for either assessments. Regional differences in mHTT reflect cellular density. STR = striatum, CTX = cortex, HIPP = hippocampus, DG = dentate gyrus, CA1 = hippocampal CA1 subfield, CA2 = hippocampal CA2 subfield, CA3 = hippocampal CA3 subfield. Data presented as means ± SEM.

