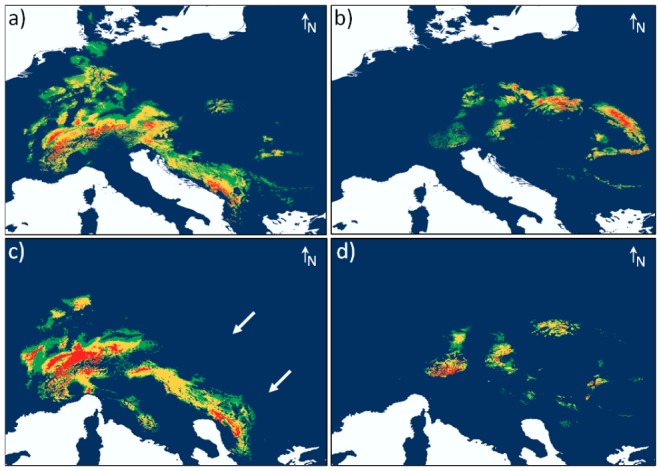
Figure 2. Western European distribution model for (a) current and (c) past climate conditions and Carpathian distribution model for (b) current and (d) past climate conditions.

Past distribution is shown for the Last Glacial Maximum (LGM, 21,000 BP). Warmer colors show areas with better predicted conditions (green: p>0.3, yellow: p>0.5, red: p>0.7).
