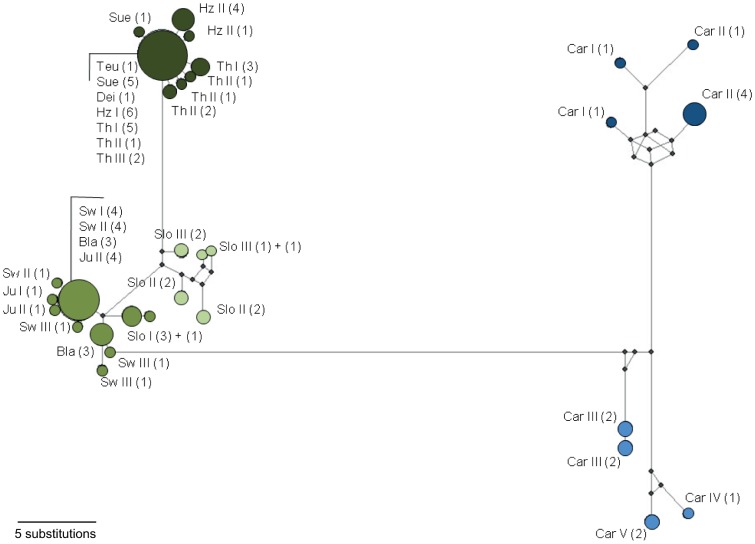
Figure 5. Median-joining network of mtDNA haplotypes based on concatenated CO1+ND5 sequences.
Circles represent haplotypes; circle size and numbers in brackets indicate the haplotype frequency within our samples. Small black circles/nodes indicate intermediate haplotypes between observed haplotypes. Haplotype circles are filled corresponding to the colour code for the subclades also used in Figure 1 and 3.

