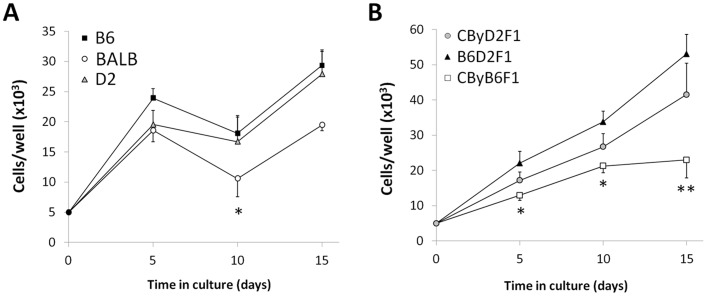
Figure 1. Effects of genetic background on in vitro ADSC expansion.
ADSCs from B6, BALB, and D2 (A) or their F1 hybrids (B) were plated and grown in culture for 5, 10, or 15 days. Cells were quantified by amounts of DNA tested using Hoechst 33258 and an external standard curve. Data are mean ± S.E. (n = 5–8 per data point). In panel A, *P<0.05 vs. BALB ADSCs at day 5 and day 15. In panel B, *P<0.05 and **P<0.01 vs. B6D2F1 ADSCs at respective time points.

