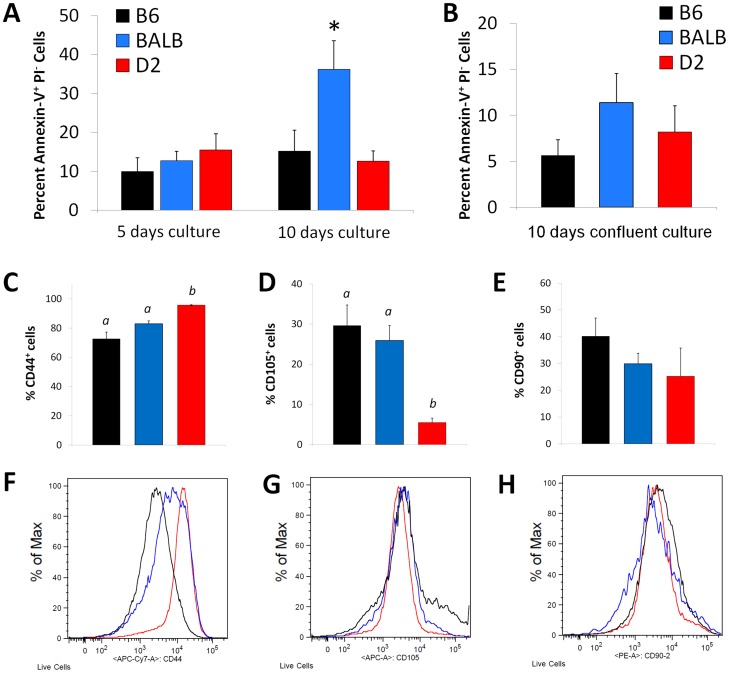
Figure 2. Effects of genetic background on ADSC apoptosis in vitro.
Apoptosis in B6 (black), BALB (blue), and D2 (red) ADSCs was assessed at 5 days and 10 days in culture; apoptosis was measured by Annexin V-FITC (A). Bar values are expressed as mean ± S.E. (n = 5–8). BALB at 10 days differed with *P<0.05 vs. B6 and D2, as well as vs. BALB day 5 and BALB-confluent day 10. B6, BALB, and D2 ADSCs were cultured for 10 days at confluence and apoptosis was assessed (B). Bar values are expressed as mean ± S.E. (n = 5–8). To test if cell populations differ by strain, ADSC cell surface markers were analyzed by flow cytometry for the proportion of live cells positive for: CD44 (C, F), CD105 (D, G), and CD90 (E, H). Bar values are mean ± S.E. (n = 8–9 per data point). Mean values with dissimilar superscript letters are significantly different (P<0.05).

