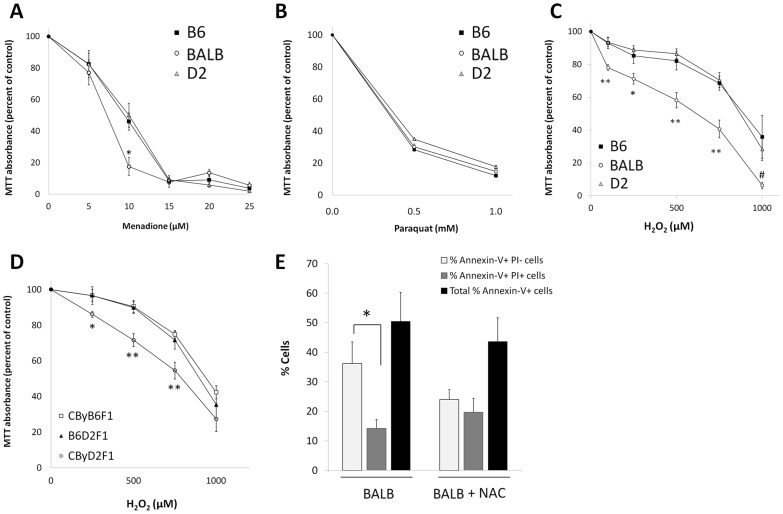
Figure 3. Effects of genetic background on ADSC oxidative stress resistance.
MTT assays were performed to assess the cell viability of B6, BALB, and D2 ADSCs following treatment with menadione (A), paraquat (B), and H2O2 (C). Data are expressed as mean ± S.E. (n = 3 for menadione; n = 5–6 for H2O2; *P<0.05 vs. B6 and D2 and **P<0.01 vs. B6 and D2). Cell viabilities of F1 hybrid ADSCs were measured by MTT assay after treatment with H2O2 (D). Data are expressed as mean ± S.E. (n = 5–6; *P<0.05 vs. B6D2F1 and CByB6F1; **P<0.01 vs. B6D2F1 and CByB6F1). BALB ADSCs were treated with and without 4.0 mM NAC in growth media for 10 days and apoptosis was measured (E). Data are expressed as percentages of Annexin-V+ cells that are either positive or negative for PI (n = 5–7, *P<0.05).

