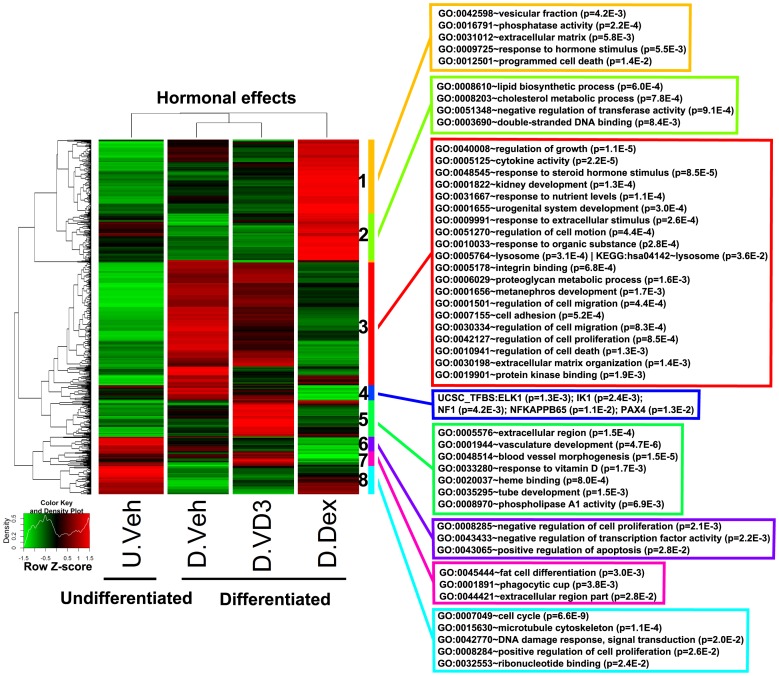
Figure 2. Clustering and functional analysis of genes representing hormonal effects during HPC differentiation.
The genes representing hormonal effects (D.Dex-D.Veh and D.VD3-D.Veh) were clustered and their relative expression was plotted using a heatmap. The subclusters were identified as described in Methods and labeled by the color sidebar and numbers (1–8). Functional analysis identified the significantly influenced categories (P<0.05) associated with each subcluster and the representative ontology terms are shown in the color-matched boxes.

