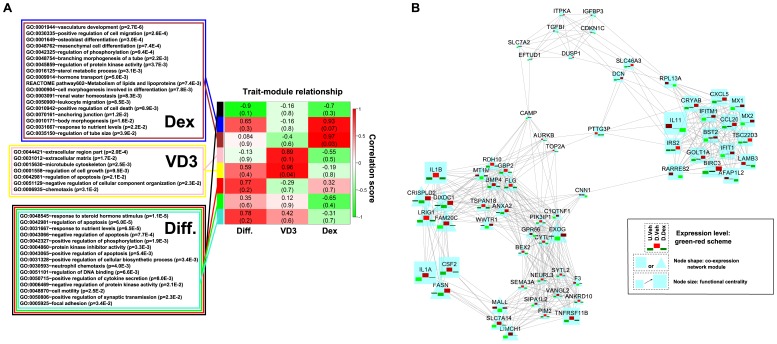
Figure 5. Modules associated with hormonal treatments during HPC differentiation identified by weighted gene co-expression network analysis.
The significantly changed probes (>1.5 fold, q<0.05) representing hormonal effects (D.Dex-D.Veh and D.VD3-D.Veh) were used for the WGCNA analysis. (A) Three traits of the samples were defined to study the module-trait relationships: ''Diff'' trait categorizes the samples into differentiated (D.Veh, D.VD3, D.Dex) and un-differentiated (U.Veh). “VD3” trait categorizes the samples into untreated (U.Veh, D.Veh. D.Dex) or VD3-treated (D.VD3). ''Dex'' trait categorizes the samples into untreated (U.Veh, D.Veh, D.VD3,) or Dex-treated (D.Dex). The module-trait correlation is represented as a heatmap with correlation coefficient (r) scaled to a green-white-red scheme. The correlation coefficients and the p values are shown in each box. Specifically, the blue and brown modules are highly correlated with the “Dex” trait. The pink and yellow modules are highly correlated to ''VD3'' trait. The rest of modules are modestly or weakly correlated with the “Diff” trait. Functional analysis identified significantly (P<0.05) influenced functional categories for different trait-associated modules. The ontology terms are listed in the color-matched boxes. (B) The co-expression network of the most significantly changed genes (>2 fold, q<0.01) that are highly correlated with the “Dex” trait. The network was analyzed by FUNNET and visualized in Cytoscape. The scaled expression values of each gene under the different conditions (U.Veh, D.Veh, and D.Dex from left to right) were overlaid on the node with a green-red scheme [53]. Node shape reflects membership of different network modules. The node size is scaled to the functional centrality.

