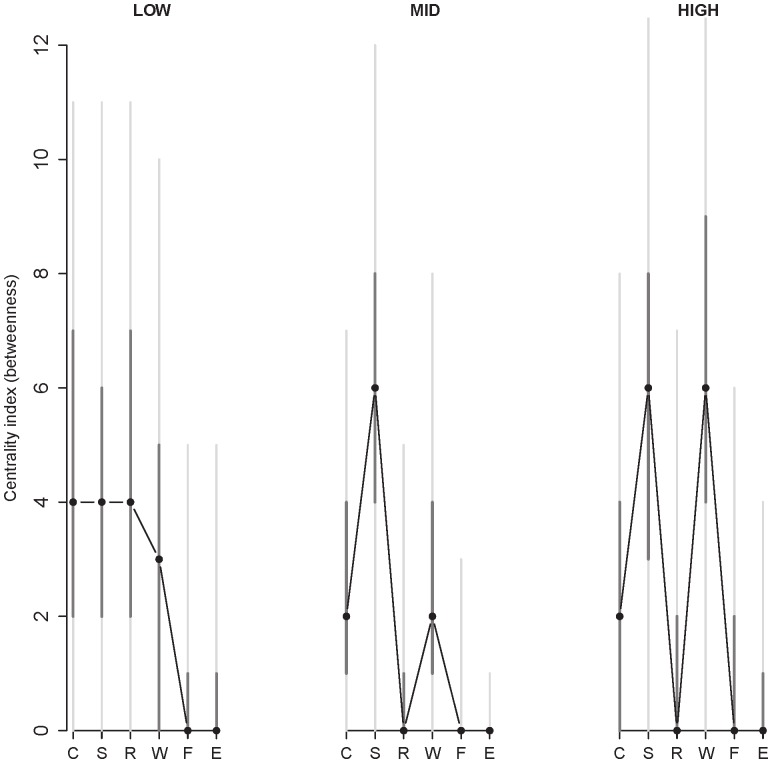
Figure 4. Centrality (betweenness) of each item in the network as a function of level of neuroticism at baseline.
Low, mid, and high neuroticism are shown from left to right. The labels of the items are abbreviated by their first letter (C = cheerful, S = sad, R = relaxed, W = worry, F = fearful and E = event). The black dots are the model-based estimate of betweenness, the darkgrey vertical lines represent 50% confidence intervals and the light grey vertical lines represent 95% confidence intervals (as estimated from the bootstrap method). Together, the median, 50% and 95% confidence intervals give information on how the node centrality for every item in all three networks is distributed.

