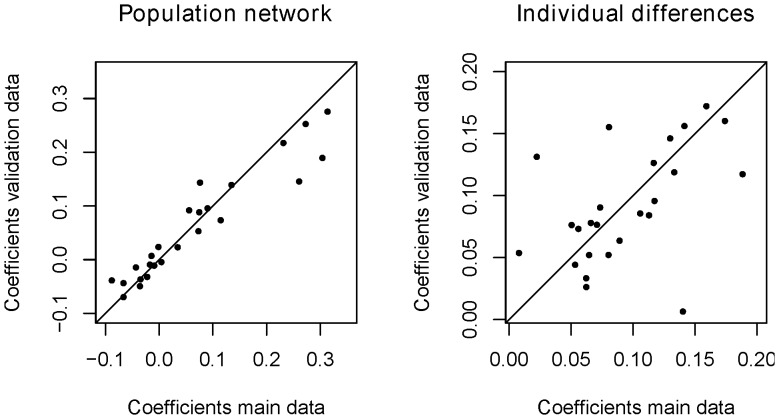
Figure 5. Correspondence between the basis dataset and the validation dataset.
Left panel: Representation of the correspondence between the population network coefficients (fixed effects) of the basis dataset (x-axis) and the validation dataset (y-axis). Right panel: Representation of the correspondence between the inter-individual differences (random effects) of the basis data (x-axis) and the validation data (y-axis).

