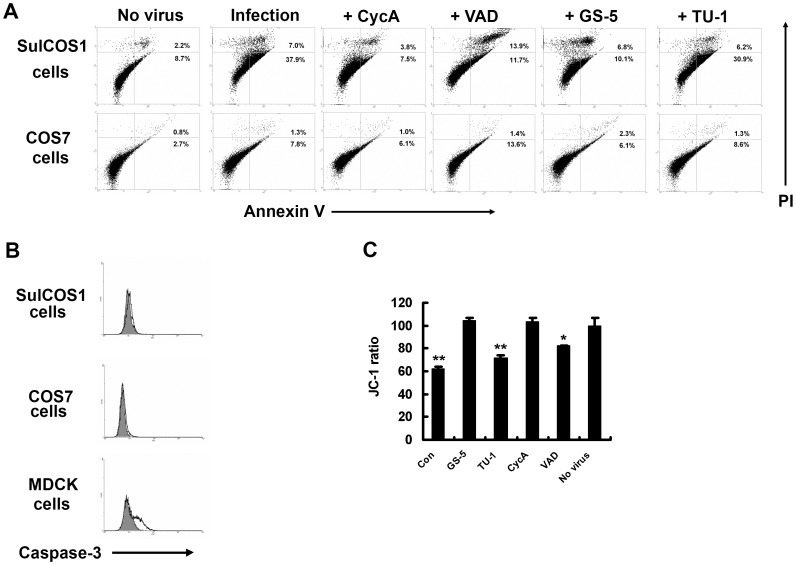
Figure 1. Inhibitory effects of CycA and GS-5 treatment on virus-induced apoptosis.
Virus-infected SulCOS1 cells were incubated at 34°C for 24 h. A, Inhibitory effects of CycA and GS-5 on virus-induced apoptosis at 24 h postinfection. CyA and VAD were used at 20 µM and 50 µM, respectively. B, Detection of active caspase-3 in virus-infected cells. MDCK cells were used as a positive control of caspase-3 activation. Gray-painted histograms and lined histograms were results of non-infected cells and infected cells, respectively. The results shown in (A) and (B) are representative data of two repeated experiments. C, Inhibitory effects of CycA and GS-5 on mitochondrial membrane potential loss in virus-infected cells. The JC-1 ratio of each cell was calculated as red value per green subtracted by respective fluorescent values of no cells and is shown as a relative percentage of non-infected cells. The results (± standard deviation) shown are average values of three experiments. Student's t-test was used for statistical analysis compared to no virus in (C). *. p<0.05; **, p<0.01.

