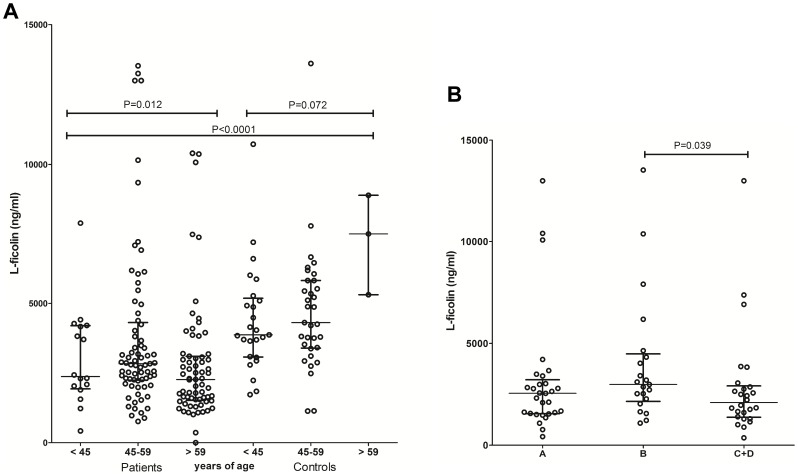
Figure 2. Distribution of L-ficolin levels based on age and clinical classification.
(A) L-ficolin levels in Chagas patients and controls according to age (B) L-ficolin levels in Chagas patients and controls based on class of cardiac commitment. The statistical distribution is shown with median and interquartile range. One outlier (18880.7 ng/ml) was excluded for better visualization in the 45–59 group of patients.

