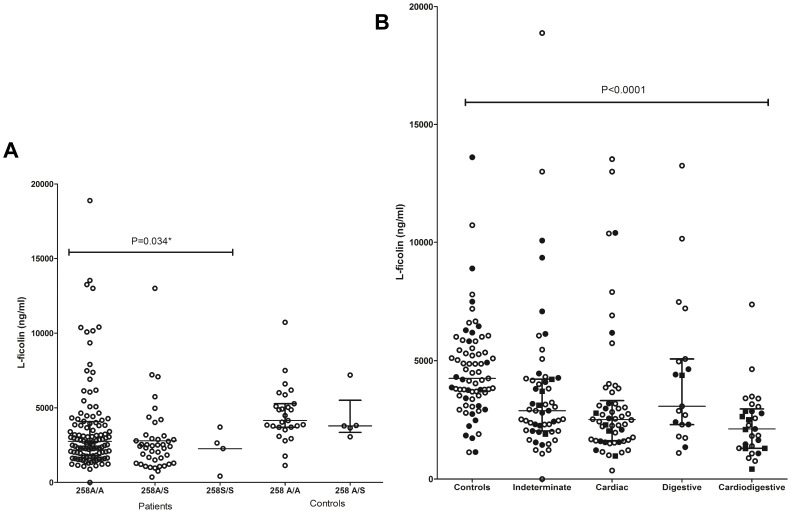
Figure 3. Distribution of L-ficolin levels based on genotypic variant and disease stages.
(A) L-ficolin levels in Chagas patients and controls by the presence of 258S variant and (B) Distribution of L-ficolin levels in Chagas patients and controls by disease stages. The statistical distribution is shown with median and interquartile range. Closed dots: samples with −4 A/G genotype. Closed boxes: samples with −4 A/G and 258A/S (AGGA/GGAS genotype) or 258S/S homozygotes (GGAS/GGAS genotype).

