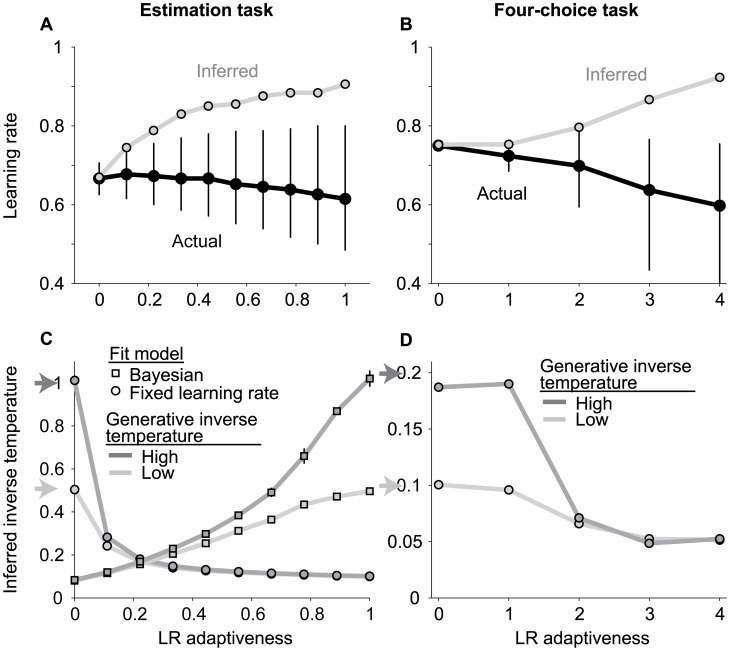
Figure 1. Learning-rate adaptiveness can be misinterpreted as elevated fixed learning rates and decreased inverse temperatures for the estimation (A,C) or four-alternative (B,D) tasks (see text).
In all panels, the abscissa represents learning-rate adaptiveness (0 is equivalent to using a fixed learning rate; higher numbers indicate higher adaptiveness to unexpected errors). A & B. Actual (black) and model-inferred (gray) learning rates used by agents with different levels of learning-rate adaptiveness. Points and error bars represent the median and interquartile range, respectively, of data from six simulated sessions. C & D. Best-fitting values of the inverse-temperature parameter, intended to describe exploratory behavior, inferred using a fixed delta-rule (circles) or approximately Bayesian (squares) model. Shades of gray indicate the level of exploratory behavior of the simulated agent, as indicated. Arrows indicate the actual value of the inverse-temperature parameter used in the generative process. Points and error bars (obscured) represent the mean and standard error of the mean, respectively, of data from six simulated sessions.

