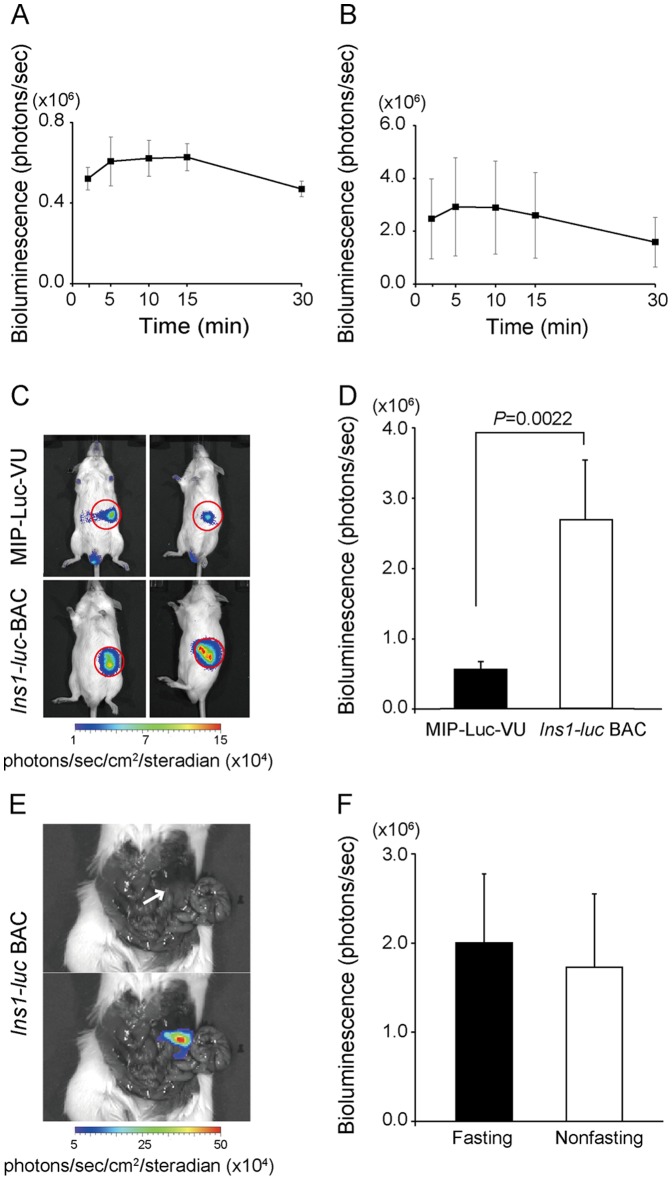
Figure 2. In vivo bioluminescence imaging of MIP-Luc-VU and Ins1-luc BAC transgenic mice.
(A, B) Changes in bioluminescence intensity of (A) MIP-Luc-VU (n = 3) and (B) Ins1-luc BAC transgenic (n = 3) mice following intraperitoneal injection of luciferin. (C) Representative bioluminescence imaging of MIP-Luc-VU mice (upper) and Ins1-luc BAC transgenic mice (lower). Circles indicate regions of interest. (D) Quantification of signal intensity in male MIP-Luc-VU mice (n = 6) and male Ins1-luc BAC transgenic mice (n = 18). (E) Bioluminesence images of laparotomized Ins1-luc BAC transgenic mice immediately after injection of luciferin. The arrow indicates the pancreas. (F) Quantification of the signal intensity of Ins1-luc BAC transgenic mice in the fasting and nonfasting states.

