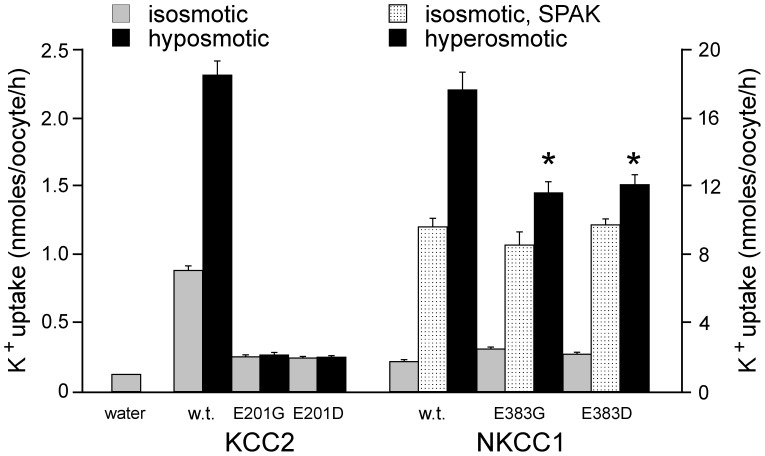
Figure 10. Effect of E289G-like mutations in KCC2 and NKCC1.
K+ influx was measured through unidirectional 86Rb tracer uptake in oocytes injected with water, wild-type KCC2 or KCC2-E201G or KCC2-E201D mutant cRNAs, and wild-type or NKCC1-E383G or NKCC1-E383D mutant cRNAs. Uptakes were measured under isosmotic (200 mOsM) and hypotonic (100 mOsM) solutions for KCC2 and under isotonic and hypertonic (265 mOsM) solutions for NKCC1. Bars represent means±SEM (n = 20–25 oocytes). Fluxes are expressed in nmoles K+/oocyte/h. (*) Denotes statistical significance with P<0.001 (ANOVA followed by Tukey-Kramer Multiple Comparisons Test). Experiment was done once.

