FIGURE 12.
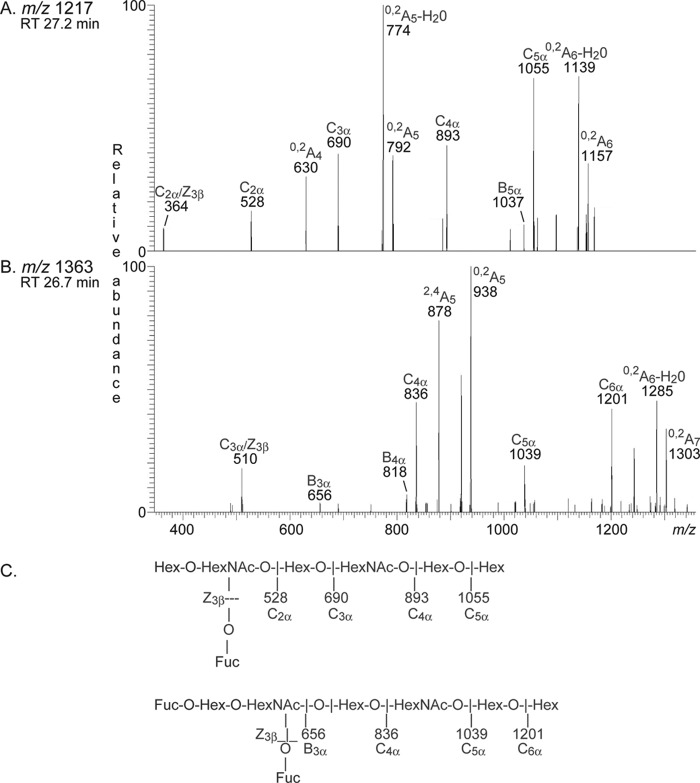
MS2 of complex oligosaccharides in fractions 181:IV-C and 181:IV-D from human embryonic stem cell line SA181. RT, retention time. A, MS2 spectrum of the ion at m/z 1217 of fraction 181:IV-C from human embryonic stem cell line SA181 (retention time 27.2 min). B, MS2 spectrum of the ion at m/z 1363 of fraction 181:IV-D from human embryonic stem cell line SA181 (retention time 26.7 min). C, interpretation formulas.

