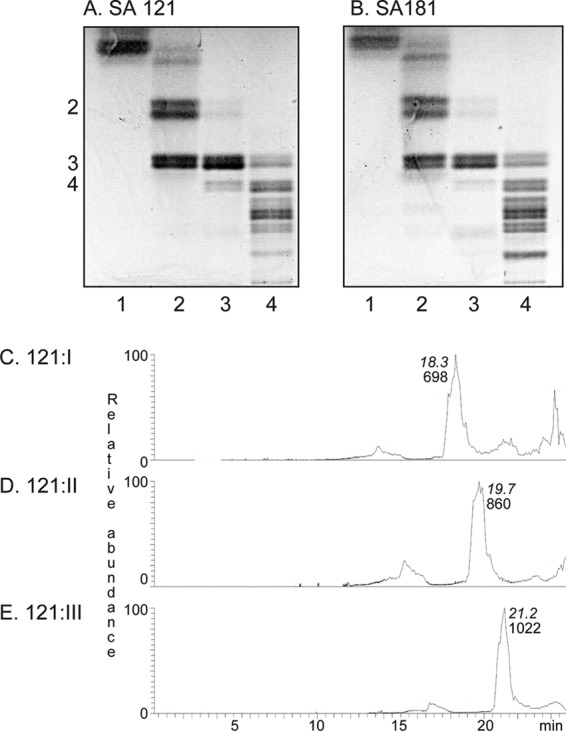
FIGURE 2.

Thin-layer chromatograms of the isolated non-acid glycosphingolipid fractions from human embryonic cell lines SA121 and SA181 and ESI/MS of fractions 121:I–III (mono-, di-, and triglycosylceramides). A, lane 1, fraction 121:I from cell line SA121 (10 μg); lane 2, fraction 121:II (10 μg); lane 3, fraction 121:III (10 μg); lane 4, fraction 121:IV (20 μg). B, lane 1, fraction 181:I from cell line SA181 (10 μg); lane 2, fraction 181:II (10 μg); lane 3, fraction 181:III (10 μg); lane 4, fraction 181:IV (20 μg). The numbers to the left of the chromatogram in A denote the approximate number of carbohydrate residues in the bands. The thin-layer chromatograms were eluted with chloroform/methanol/water (60:35:8, v/v/v), and anisaldehyde was used for detection of glycosphingolipids. C, base peak chromatogram from ESI-MS of fraction 121:I from human embryonic stem cell line SA121. D, base peak chromatogram from ESI-MS of fraction 121:II from human embryonic stem cell line SA121. E, base peak chromatogram from ESI-MS of fraction 121:III from human embryonic stem cell line SA121. The retention times of the molecular ions are given in italic type.
