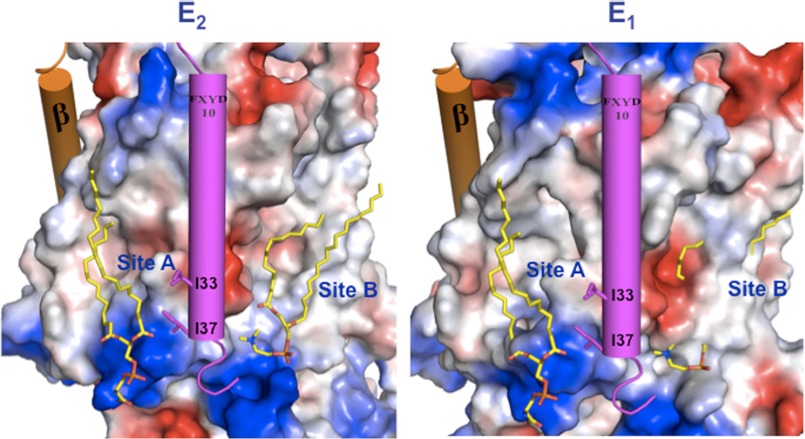
FIGURE 9.
Phospholipid binding sites in E2 and E1 conformations. Surface charge representation (positive in blue, negative in red, calculated using PyMOL) of the α subunit for the E2 (a) and homology-modeled E1 (b) conformations of the Shark Na,K-ATPase. Lipids are modeled as yellow sticks, and FXYD10 and β TMs are rendered as magenta and orange cylinders, respectively.

