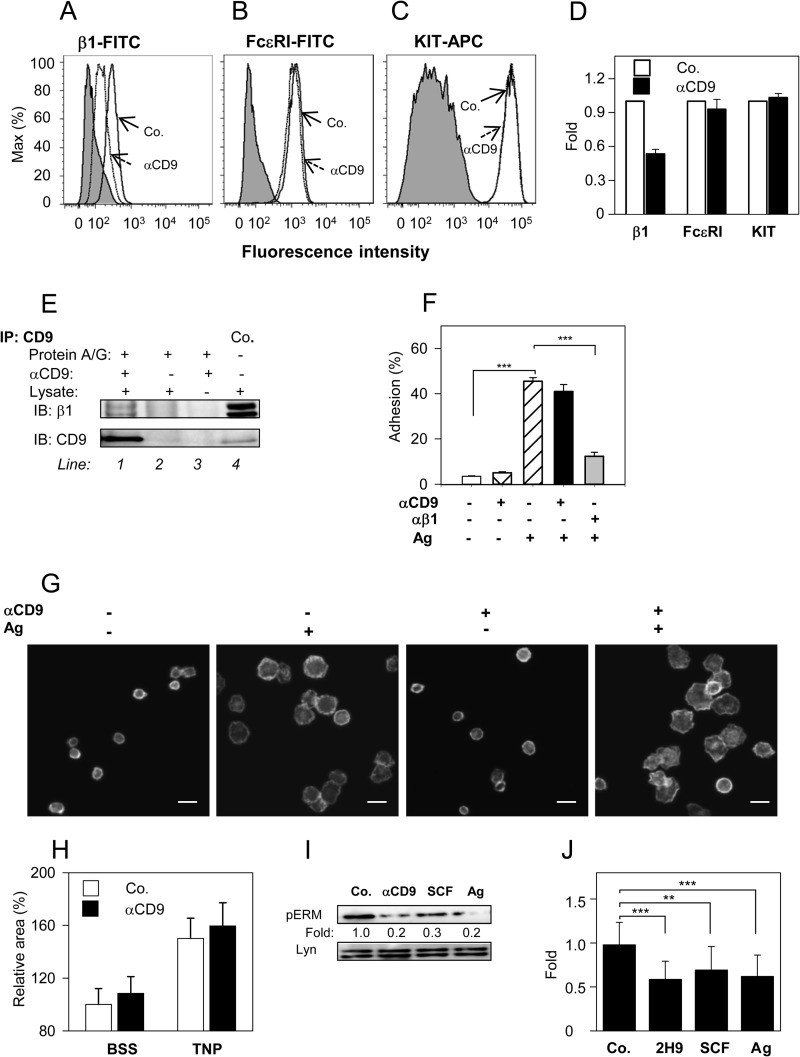
FIGURE 7.
CD9 aggregation does not interfere with β1-integrin function, but induces dephosphorylation of ERM proteins. A-D, BMMCs were pretreated or not with anti-CD9 mAb 2H9 (1 μg/ml) for 15 min and the binding anti-integrin-β1-FITC conjugate (A), anti-FcϵRI-FITC conjugate (B), and anti-c-Kit-APC conjugate (C) were estimated by flow cytometry. Gray filled regions represent control cells not exposed to antibodies; dashed and thick lines indicate antibody binding to anti-CD9 treated (dashed; αCD9) or nontreated cells (thick; Co.). D, data obtained as in A-C were normalized to maximal values obtained in the absence of anti-CD9; mean ± S.D. were determined from at least 3 independent experiments. E, BMMCs (107 per sample) were solubilized in lysis buffer supplemented with 1% CHAPS. CD9 was immunoprecipitated from postnuclear supernatants by 2H9 mAb immobilized on protein A/G beads (line 1). Material bound to protein A/G beads without 2H9 mAb (line 2) or 2H9 mAb armed protein A/G beads without cell lysate (line 3) served as negative controls. Whole lysates from 2.5 × 10⁵ cells were used as positive controls (Co.; line 4). Immunoprecipitated material and controls were recovered in SDS-PAGE sample buffer with or without 2-mrecaptoethanol. Reduced and unreduced samples were immunoblotted with anti-β1 integrin (β1) or anti-CD9 (CD9), respectively. F, cell adhesion to fibronectin. IgE-sensitized and Calcein-loaded BMMCs were incubated with (+) or without (−) anti-CD9 mAb 2H9 and/or anti-β1 integrin antibody for 15 min before their transfer into fibronectin-coated wells. Adherence to fibronectin was determined by fluorometry after a 30-min exposure of the cells to Ag (+) or BSSA alone (−). Fluorescence was evaluated before (100%) and after washing out the non-adherent cells and percentages of adherent cells were calculated. G, cell spreading on fibronectin. IgE-sensitized BMMCs were pretreated (+) or not (−) with anti-CD9 mAb 2H9 and allowed to attach to fibronectin immobilized on glass surface. Then the cells were exposed (+) or not (−) to Ag for 20 min, fixed, permeabilized, and stained for actin with Alexa Fluor 488-phalloidin conjugate. Examples of the cells are shown. Bars, 20 μm. H, average areas of the cells processed as in G were calculated using automated CellProfiller software. Mean ± S.D. from three independent experiments, each involving ∼500 cells, are shown. I, IgE-sensitized BMMCs were nonactivated (Co.) or activated with 2H9 mAb (αCD9), SCF, or Ag for 3 min. Whole cell lysates were prepared and analyzed by immunoblotting with p-ERMT-specific Ab; anti-Lyn was used as a loading control. Numbers correspond to the fold-increase in phosphorylation after normalization to the total amount of protein and phosphorylation in nonactivated cells. Typical results are shown. J, mean ± S.D. were calculated from 10 to 18 independent experiments performed as in I. **, p < 0.01; ***, p < 0.001.

