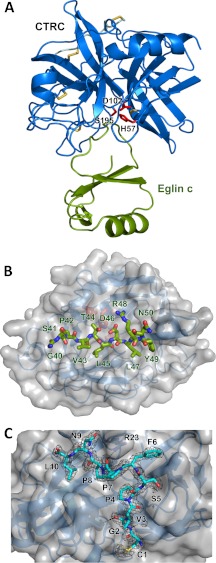
FIGURE 1.
Crystal structure of the CTRC-eglin c complex. A, structural overview of the complex. CTRC is shown in blue, with catalytic triad residues Ser195, His57, and Asp102 in red and disulfide links in yellow. Eglin c is displayed in green. B, view into the substrate binding cleft of CTRC. CTRC is shown with a semitransparent gray surface. Eglin c binding loop residues 40–50 are rendered in stick representation, filling (from left to right) CTRC S6-S1 and S1′-S5′ subsites. C, retained activation peptide of CTRC. Residues 1–10 of the chymotrypsin C activation peptide are tethered to the activated enzyme through a disulfide link between Cys1 and Cys122. The activation peptide is depicted in cyan in stick representation, with a 2Fo − Fc electron density map contoured at 1.6σ. Strong density around the Leu10 carboxyl terminus confirms that residues 11–13 of the activation peptide are not disordered but have been proteolytically removed.

