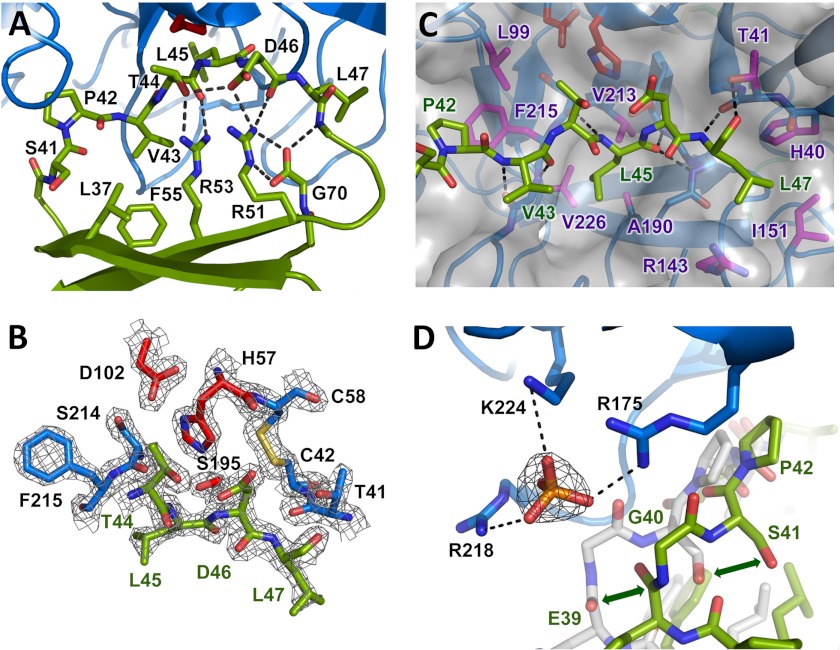
FIGURE 2.
Eglin c inhibitory interaction with CTRC. A, stabilization of the inhibitory loop of eglin c. The eglin c binding loop assumes a substrate-like canonical conformation of the peptide backbone, stabilized on the nonprimed side by hydrophobic interactions of Leu37, Val43, and Phe55, and on the primed side by an H-bond network involving Thr44, Asp46, the Arg48 amide nitrogen, Arg51, Arg53, and C-terminal Gly70. The side chain of Arg48 is omitted for clarity. B, the CTRC-eglin c complex resembles an enzyme-substrate Michaelis complex. The Leu45-Asp46 reactive site peptide bond of eglin c, linking the P1 and P1′ residues, lies in proper orientation for attack by the catalytic Ser195 of CTRC. The 2Fo − Fc electron density map is shown contoured at 2.0σ. C, key CTRC-eglin c binding interactions. The eglin c P1 residue Leu45 fills the S1 pocket bordered by CTRC Ala190, Val213, and Val226. P4 residue Pro42 fills a hydrophobic concavity formed by CTRC Leu99 and Phe215. P2′ residue Leu47 fills a pocket formed by CTRC Arg143 and Ile151. Multiple backbone H-bonds orient the inhibitor, indicated by black dotted lines. D, positively charged P6 pocket displaces eglin c backbone to bind phosphate. Basic side chains of CTRC Arg175, Arg218, and Lys224 coordinate a phosphate ion, displacing eglin c from the orientation in which it is found in complex with bovine α-chymotrypsin (shown in semitransparent white stick representation; PDB code 1ACB). The 2Fo − Fc electron density map shown for the phosphate ion is contoured at 1.6σ.

