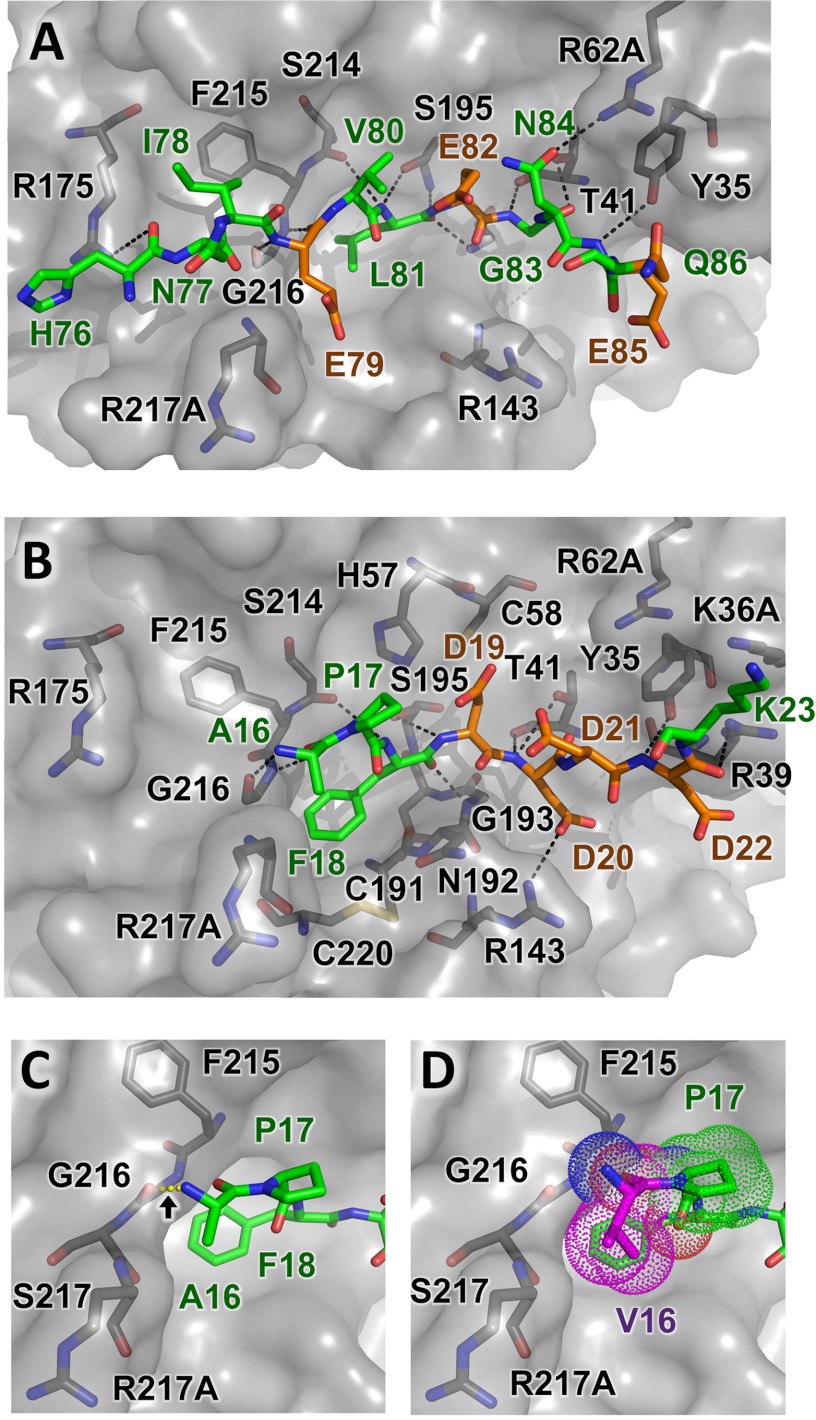
FIGURE 5.
Structural modeling of CTRC-substrate interactions. A, trypsinogen Ca2+-binding loop substrate positioning relative to nearby CTRC residues illustrates H-bonds formed between enzyme and substrate as black dotted lines. None of substrate acidic residues Glu79, Glu82, or Glu85 lie in close enough proximity to the CTRC basic side chains to form direct salt bridges. B, a similar view showing a model of trypsinogen activation peptide cleavage sequence bound to CTRC. This shorter alternative substrate forms one fewer non-primed side hydrogen bond with the enzyme, and lacks the hydrophobic stabilization that would be provided by a P4 substrate residue. However, a direct salt bridge is formed between P2′ residue Asp20 and CTRC Arg143. C and D, minimal differences are present in models of trypsinogen activation peptide (C) and p.A16V mutant (D) bound to CTRC. Where the Ala16 N-terminal amine is predicted to hydrogen bond with the CTRC Gly216 carbonyl (C), rotation of the Val16 (magenta) eliminates this bond but the bulkier side chain forms additional hydrophobic contacts with the Pro17 ring and the β-carbon of Arg217A (D).

