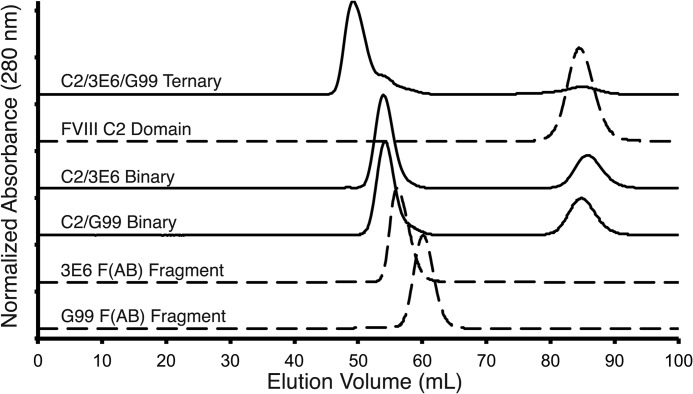
FIGURE 3.
Size exclusion chromatography of proteins and complexes. Relative elution volumes for each protein and/or complex are overlaid with normalized absorption values. Dashed lines, uncomplexed protein components (C2 domain, G99 Fab, and 3E6 Fab); solid lines, binary and ternary protein complexes (C2-G99 Fab binary, C2–3E6 Fab binary, and C2–3E6 Fab-G99 Fab ternary). An excess of the fVIII C2 domain was present in each complex to ensure saturation of Fab-binding sites.

