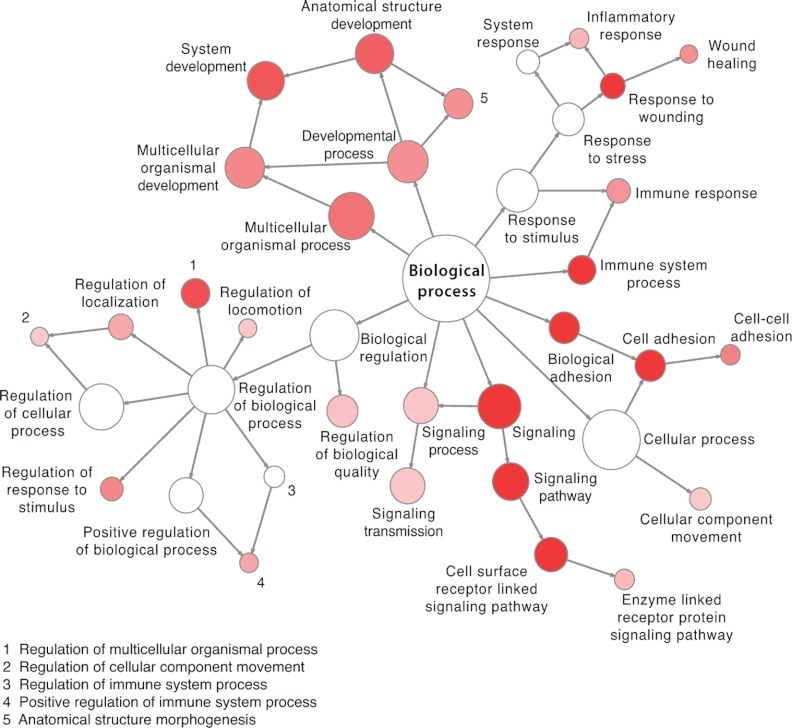
Fig. 1.
Functional annotation of human N-glycoproteins covered by N-glycoprotein SRMAtlas. The graph shows highly enriched biological processes among the human N-glycoproteins (colored in red). The node size is according to the number of proteins corresponding to each biological process, and the intensity of the color is according to the p value.

