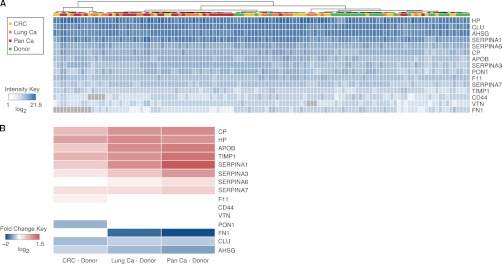
Fig. 3.

Quantitative abundance trends of cancer-associated proteins. A, 15 N-glycoproteins were quantified by SRM in plasma samples of 120 subjects. The clinical cohort was comprised of three malignancy groups (colorectal cancer (CRC), lung cancer (Lung Ca), and pancreatic cancer (Pan Ca), depicted in yellow, orange, and red, respectively) and a control donor group (depicted in green). Unsupervised clustering was applied on the quantitative data matrix. Higher abundance is depicted with higher intensity of blue, and gray color indicates missing values in the dataset. B, significant abundance changes between the distinct type of cancer (colorectal, lung, or pancreatic) and the controls (healthy blood donors) are depicted in red (as an increase in abundance in cancer) or in blue (as a decrease in abundance in cancer). White indicates no significant difference (at a cutoff of p ≤ 0.01, fold change ± 1.1).
