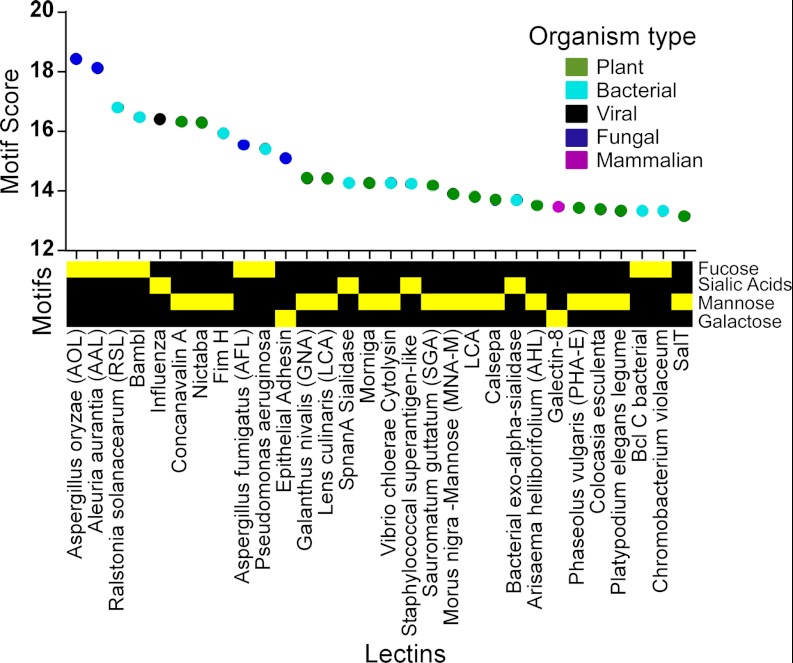
Fig. 2.
The top 30 motif scores. The motif score is indicated along the y-axis, the labels on the x-axis give the lectin name, and the color gives the organism category of each lectin. The motif type is indicated by the yellow squares below the lectin names. Only four motif types, all simple monosaccharides, are represented in the top 30.

