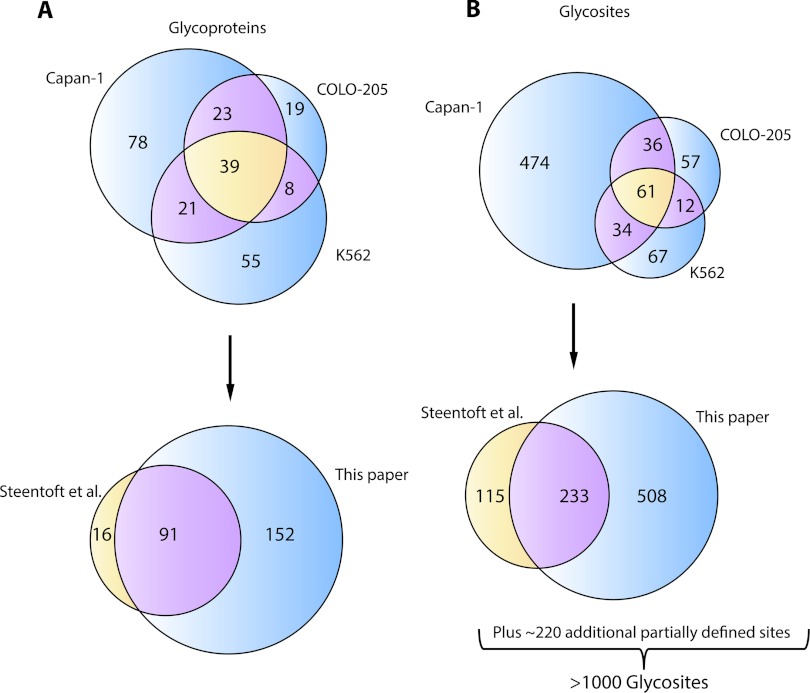
Fig. 6.
Venn diagrams showing uniqueness and overlap between data sets obtained from three SimpleCell lines studied with respect to identified O-glycoproteins (A) and O-glycosites (B). Cell line totals are presented individually versus each other (top) and as cumulative totals compared with data obtained previously by Steentoft et al. (5) (bottom).

