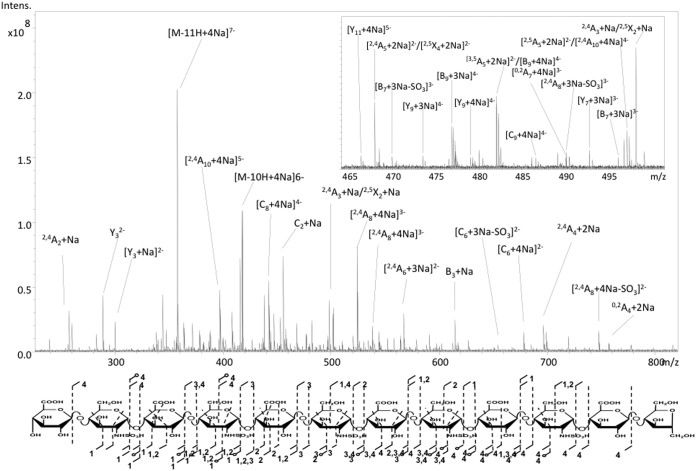
Fig. 6.
CID spectrum of chemoenzymatically produced dodecasaccharide precursor [M − 11H + 4Na]7− with the inset showing a small zoomed in region of the spectrum with the annotations. Only the intense peaks are annotated, but all fragment assignments for this analyte can be found in the supplemental material.

